Hi rjz,
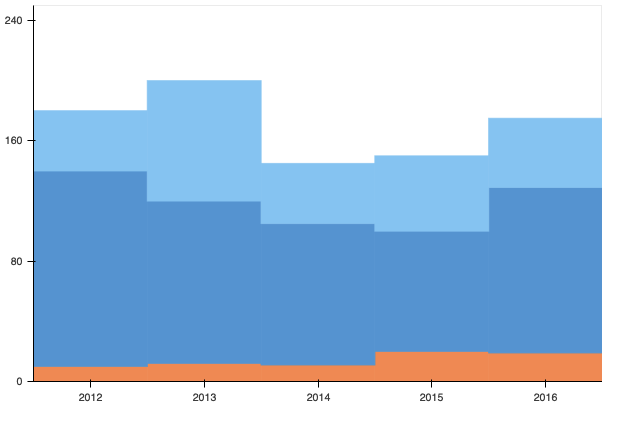
The easiest way to do this is probably with a vbar_stack. Here’s an example, approximating your example:
from bokeh.plotting import figure, show
from bokeh.models import ColumnDataSource

x = [2012, 2013, 2014, 2015, 2016]
y1 = [10, 12, 11, 20, 19]
y2 = [130, 108, 94, 80, 110]
y3 = [40, 80, 40, 50, 46]
light_blue = '#90c9f5'
med_blue = '#5f9cd9'
orange = '#f29456'

source = ColumnDataSource(dict(x=x, y1=y1, y2=y2, y3=y3))

p = figure(title=None, plot_width=600, plot_height=400, min_border=0, toolbar_location=None, x_range=(2011.5, 2016.5), y_range=(0, 250))
p.vbar_stack(['y1', 'y2', 'y3'], x='x', width=1, color=[orange, med_blue, light_blue], source=source)

p.grid.grid_line_color = None
p.xaxis.ticker = x
p.yaxis.ticker = [0, 80, 160, 240]
p.axis.minor_tick_line_color = None

show(p)
