Stacked bar chart using pandas DataFrame and vbar in Bokeh plot

Hi everyone,

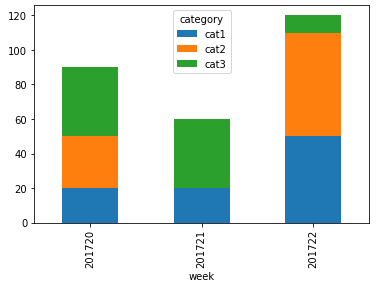
I am looking for bokeh version (using vbar) of the following plot in matplotlib:

import pandas as pd
%matplotlib inline

data = [
    ['201720', 'cat1', 20],
    ['201720', 'cat2', 30],
    ['201720', 'cat3', 40],
    ['201721', 'cat1', 20],
    ['201721', 'cat2', 0],
    ['201721', 'cat3', 40],
    ['201722', 'cat1', 50],
    ['201722', 'cat2', 60],
    ['201722', 'cat3', 10],
]

df = pd.DataFrame(data, columns=['week', 'category', 'count'])

pt = df.pivot('week', 'category', 'count')

pt.plot(kind='bar', stacked=True)

I seemed to find some related posts/answers after googling half day but still I have no idea how I can do that.

I think the following code is the best I can do as of now:


from bokeh.plotting import figure, output_file, show

from bokeh.models import ColumnDataSource

from bokeh.models.ranges import FactorRange

import pandas as pd

data = [

['201720', 'cat1', 20],

['201720', 'cat2', 30],

['201720', 'cat3', 40],

['201721', 'cat1', 20],

['201721', 'cat2', 0],

['201721', 'cat3', 40],

['201722', 'cat1', 50],

['201722', 'cat2', 60],

['201722', 'cat3', 10],

]

df = pd.DataFrame(data, columns=['week', 'category', 'count'])

pt = df.pivot('week', 'category', 'count')

pt = pt.cumsum(axis=1)

output_file("lines.html", title='Dashboard')

p = figure(title="count",

x_axis_label='week', y_axis_label='category',

x_range = FactorRange(factors=list(pt.index)),

plot_height=300, plot_width=500)

p.vbar(x=pt.index, bottom=0, top=pt.cat1, width=0.2, color='red', legend='cat1')

p.vbar(x=pt.index, bottom=pt.cat1, top=pt.cat2, width=0.2, color='blue', legend='cat2')

p.vbar(x=pt.index, bottom=pt.cat2, top=pt.cat3, width=0.2, color='green', legend='cat3')

show(p)

The resulting plot looks like what’s expected.

What I wonder is this:

Including vbar(), Bokeh plotting methods do not seem to support ‘vectorized input’ or maybe I am missing something. Is this really the simplest(most efficient) way?

Would be very interested to know this as well…The current documentation also has nothing on stacked bar charts.

The documentation was updated some time ago with an entire section on stacked charts:

Handling categorical data — Bokeh 2.4.2 Documentation

E.g. here is a very simplified version:

from bokeh.io import show
from bokeh.plotting import figure

fruits = ['Apples', 'Pears', 'Nectarines', 'Plums', 'Grapes', 'Strawberries']
years = ["2015", "2016", "2017"]
colors = ["#c9d9d3", "#718dbf", "#e84d60"]

data = {'fruits' : fruits,
        '2015'   : [2, 1, 4, 3, 2, 4],
        '2016'   : [5, 3, 4, 2, 4, 6],
        '2017'   : [3, 2, 4, 4, 5, 3]}

p = figure(x_range=fruits, plot_height=250, title="Fruit Counts by Year",
           toolbar_location=None, tools="")

p.vbar_stack(years, x='fruits', width=0.9, color=colors, source=data)
show(p)

Thanks for the update!

2019년 11월 26일 (화) 오후 2:50, Bryan Van de Ven via Bokeh Discourse [email protected]님이 작성: