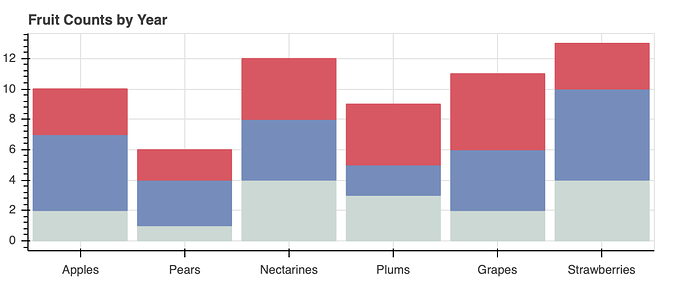
The documentation was updated some time ago with an entire section on stacked charts:
Handling categorical data — Bokeh 2.4.2 Documentation
E.g. here is a very simplified version:
from bokeh.io import show
from bokeh.plotting import figure

fruits = ['Apples', 'Pears', 'Nectarines', 'Plums', 'Grapes', 'Strawberries']
years = ["2015", "2016", "2017"]
colors = ["#c9d9d3", "#718dbf", "#e84d60"]

data = {'fruits' : fruits,
        '2015'   : [2, 1, 4, 3, 2, 4],
        '2016'   : [5, 3, 4, 2, 4, 6],
        '2017'   : [3, 2, 4, 4, 5, 3]}

p = figure(x_range=fruits, plot_height=250, title="Fruit Counts by Year",
           toolbar_location=None, tools="")

p.vbar_stack(years, x='fruits', width=0.9, color=colors, source=data)
show(p)
