Hi,
here a small piece of code to reproduce my problem
from bokeh.plotting import figure
from bokeh.models import ColumnDataSource
from bokeh.io import show
import pandas as pd
data =pd.DataFrame(data={
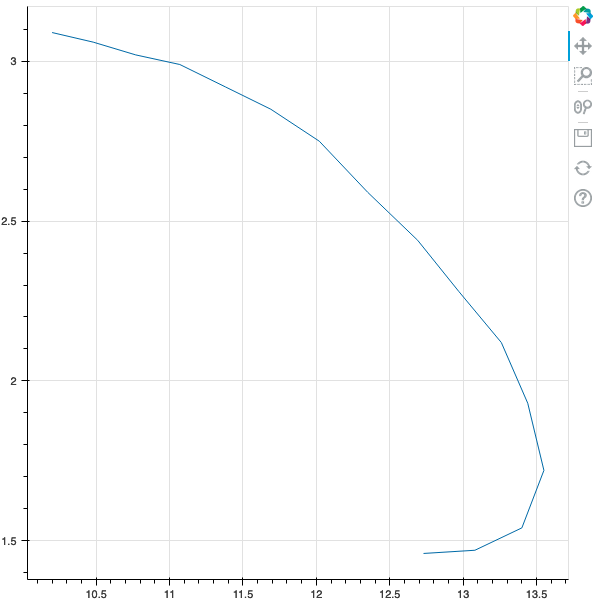
‘x_values’:[10.2, 10.48, 10.77, 11.07, 11.38, 11.69, 12.02, 12.35, 12.69, 12.97, 13.26, 13.44, 13.55, 13.4, 13.08, 12.73],
‘y_values’: [3.09, 3.06, 3.02, 2.99, 2.92, 2.85, 2.75, 2.59, 2.44, 2.28, 2.12, 1.93, 1.72, 1.54, 1.47, 1.46],
‘experiment’:[‘e’, ‘e’, ‘e’, ‘e’, ‘e’, ‘e’, ‘e’, ‘e’, ‘e’, ‘e’, ‘e’, ‘e’, ‘e’, ‘e’, ‘e’, ‘e’]
})
source = ColumnDataSource(data=data)
p = figure()
p.line(x=‘x_values’, y=‘y_values’, source=source)
show(p)
gives this
and now if I use pivot_table:
data =pd.DataFrame(data={
‘x_values’:[10.2, 10.48, 10.77, 11.07, 11.38, 11.69, 12.02, 12.35, 12.69, 12.97, 13.26, 13.44, 13.55, 13.4, 13.08, 12.73],
‘y_values’: [3.09, 3.06, 3.02, 2.99, 2.92, 2.85, 2.75, 2.59, 2.44, 2.28, 2.12, 1.93, 1.72, 1.54, 1.47, 1.46],
‘experiment’:[‘e’, ‘e’, ‘e’, ‘e’, ‘e’, ‘e’, ‘e’, ‘e’, ‘e’, ‘e’, ‘e’, ‘e’, ‘e’, ‘e’, ‘e’, ‘e’]
})
data = pd.pivot_table(data, index=‘x_values’, columns=‘experiment’, values=‘y_values’)
source = ColumnDataSource(data=data)
p = figure()
p.line(x=‘x_values’, y=‘e’, source=source)
show(p)
gives

It seems that pivot_table don’t keep the initial order of my
How can I fixe this ?
By advance thank you
Olivier
PS:In my real code I use js_on_change and so a pivot_table is needed …