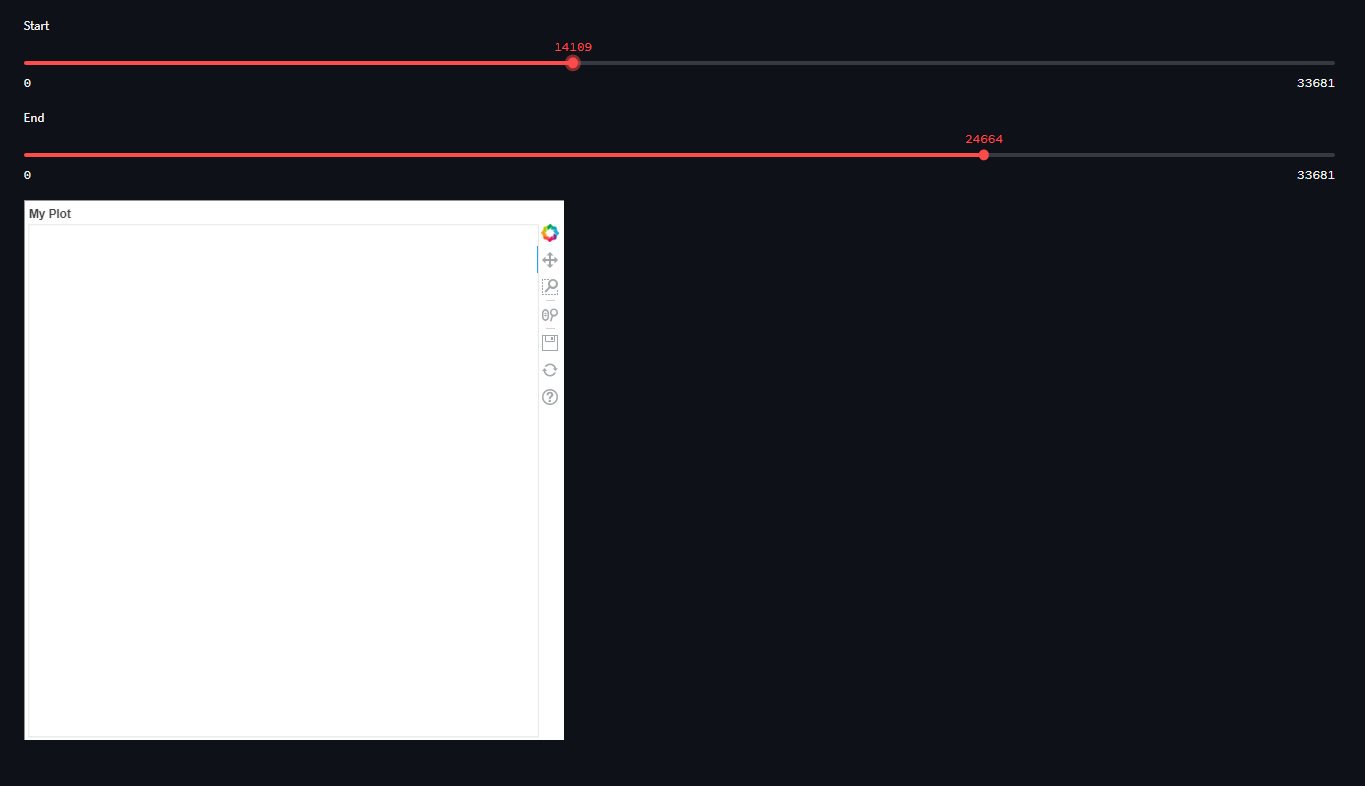
I have this code but simply nothing appears on the chart, if you can help me I would appreciate it
`
import streamlit as st
from bokeh.plotting import figure
from bokeh.models import ColumnDataSource
import pandas as pd

data = pd.read_csv("SERIE.CSV", names=["gx", "gy", "gz", "ax", "ay", "az", "roll", "pitch", "yaw", "time_stamp", "FLAG_VIDEO", "TAG"])

source = ColumnDataSource(data)
fig = figure(title="My Plot", x_axis_label="X Axis", y_axis_label="Y Axis")

fig.line(x="time_stamp", y="ax", source=source)

start = st.slider("Start", min_value=0, max_value=len(data)-1, value=0)
end = st.slider("End", min_value=0, max_value=len(data)-1, value=len(data)-1)

new_data = data.iloc[start:end+1]
source.data = ColumnDataSource.from_df(new_data)

st.bokeh_chart(fig)
`