Hello Bryan.
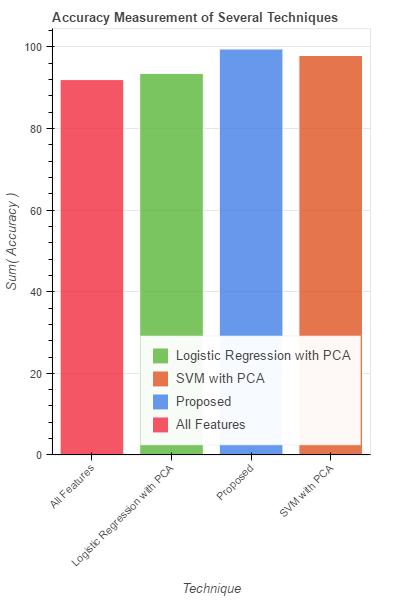
I don’t want the small squares as shown here: http://bokeh.pydata.org/en/latest/docs/user_guide/charts.html#bar-charts. And in place of numeric values, I want strings in x-axis. What should I do?
Hello Bryan.
I don’t want the small squares as shown here: http://bokeh.pydata.org/en/latest/docs/user_guide/charts.html#bar-charts. And in place of numeric values, I want strings in x-axis. What should I do?
I don’t Sum(Accuracy) as Y-Label. What Should I do?
On Tue, Feb 28, 2017 at 2:10 PM, Sayak Paul [email protected] wrote:
Hello Bryan.
I don’t want the small squares as shown here: http://bokeh.pydata.org/en/latest/docs/user_guide/charts.html#bar-charts. And in place of numeric values, I want strings in x-axis. What should I do?
–
You received this message because you are subscribed to the Google Groups “Bokeh Discussion - Public” group.
To unsubscribe from this group and stop receiving emails from it, send an email to [email protected].
To post to this group, send email to [email protected].
To view this discussion on the web visit https://groups.google.com/a/continuum.io/d/msgid/bokeh/6ed4193a-9ad7-408f-97ab-9eb587880757%40continuum.io.
For more options, visit https://groups.google.com/a/continuum.io/d/optout.
–
Thanks and Regards,
Sayak Paul,
Placement Representative,
Department of IT,
Netaji Subhash Engineering College,
2013 - 17
Phone: +918981257929
Email-ID: [email protected]
Anything onw this?
On Feb 28, 2017 7:01 PM, “Sayak Paul” [email protected] wrote:
I don’t Sum(Accuracy) as Y-Label. What Should I do?
On Tue, Feb 28, 2017 at 2:10 PM, Sayak Paul [email protected] wrote:
Hello Bryan.
I don’t want the small squares as shown here: http://bokeh.pydata.org/en/latest/docs/user_guide/charts.html#bar-charts. And in place of numeric values, I want strings in x-axis. What should I do?
–
You received this message because you are subscribed to the Google Groups “Bokeh Discussion - Public” group.
To unsubscribe from this group and stop receiving emails from it, send an email to [email protected].
To post to this group, send email to [email protected].
To view this discussion on the web visit https://groups.google.com/a/continuum.io/d/msgid/bokeh/6ed4193a-9ad7-408f-97ab-9eb587880757%40continuum.io.
For more options, visit https://groups.google.com/a/continuum.io/d/optout.
–
Thanks and Regards,
Sayak Paul,
Placement Representative,
Department of IT,
Netaji Subhash Engineering College,
2013 - 17
Phone: +918981257929
Email-ID: [email protected]
Hi Sayak,
You can remove the legend by passing legend=None to your Bar object when you create your chart. This can also be done after creating your chart by setting the location attribute of the legend attribute to None. Similarly, you can set your axis labels using either the ylabel and xlabel arguments or assigning new values to the corresponding attributes after creating your chart. Setting these values through their arguments is usually easier but, accessing them through the object attributes can be useful too. Here are some examples of what these approaches might look like in code.
Passing arguments to Bar:
my_bar = Bar(..., ylabel='my_y_label', legend=None)
Assigning desired values to attributes:
my_bar = Bar(...)
my_bar.yaxis[0].axis_label = 'my_y_label'
my_bar.legend[0].location = None
You can read more about tweaking the appearance of your plot here. This page deals with plots created using the plotting module, but there is a lot of overlap between the plotting and charts modules since charts is just a higher level abstraction of the plotting module. There are also some extra examples for bokeh charts here.
On Tue, Feb 28, 2017 at 6:57 PM, Sayak Paul [email protected] wrote:
Anything onw this?
–
You received this message because you are subscribed to the Google Groups “Bokeh Discussion - Public” group.
To unsubscribe from this group and stop receiving emails from it, send an email to [email protected].
To post to this group, send email to [email protected].
To view this discussion on the web visit https://groups.google.com/a/continuum.io/d/msgid/bokeh/CAGa_XGEn73TNqbKHPxAjpAPWjSVPUad9xALw9rT3GKpZtohMNQ%40mail.gmail.com.
For more options, visit https://groups.google.com/a/continuum.io/d/optout.
On Feb 28, 2017 7:01 PM, “Sayak Paul” [email protected] wrote:
I don’t Sum(Accuracy) as Y-Label. What Should I do?
On Tue, Feb 28, 2017 at 2:10 PM, Sayak Paul [email protected] wrote:
Hello Bryan.
I don’t want the small squares as shown here: http://bokeh.pydata.org/en/latest/docs/user_guide/charts.html#bar-charts. And in place of numeric values, I want strings in x-axis. What should I do?
–
You received this message because you are subscribed to the Google Groups “Bokeh Discussion - Public” group.
To unsubscribe from this group and stop receiving emails from it, send an email to [email protected].
To post to this group, send email to [email protected].
To view this discussion on the web visit https://groups.google.com/a/continuum.io/d/msgid/bokeh/6ed4193a-9ad7-408f-97ab-9eb587880757%40continuum.io.
For more options, visit https://groups.google.com/a/continuum.io/d/optout.
–
Thanks and Regards,
Sayak Paul,
Placement Representative,
Department of IT,
Netaji Subhash Engineering College,
2013 - 17
Phone: +918981257929
Email-ID: [email protected]
Thank you very much.
On Wed, Mar 1, 2017 at 9:11 AM, Tyler Nickerson [email protected] wrote:
Hi Sayak,
You can remove the legend by passing
legend=Noneto your Bar object when you create your chart. This can also be done after creating your chart by setting the location attribute of the legend attribute toNone. Similarly, you can set your axis labels using either theylabelandxlabelarguments or assigning new values to the corresponding attributes after creating your chart. Setting these values through their arguments is usually easier but, accessing them through the object attributes can be useful too. Here are some examples of what these approaches might look like in code.
Passing arguments to Bar:
my_bar = Bar(..., ylabel='my_y_label', legend=None)Assigning desired values to attributes:
my_bar = Bar(...)
my_bar.yaxis[0].axis_label = 'my_y_label'
my_bar.legend[0].location = None
You can read more about tweaking the appearance of your plot here. This page deals with plots created using the plotting module, but there is a lot of overlap between the plotting and charts modules since charts is just a higher level abstraction of the plotting module. There are also some extra examples for bokeh charts here.
–
You received this message because you are subscribed to the Google Groups “Bokeh Discussion - Public” group.
To unsubscribe from this group and stop receiving emails from it, send an email to [email protected].
To post to this group, send email to [email protected].
To view this discussion on the web visit https://groups.google.com/a/continuum.io/d/msgid/bokeh/CAAd1xFQM6JiR_N2PiWb5BOa6fVudRTLjOMuA%2BLERQG6eiRP92w%40mail.gmail.com.
For more options, visit https://groups.google.com/a/continuum.io/d/optout.
On Tue, Feb 28, 2017 at 6:57 PM, Sayak Paul [email protected] wrote:
Anything onw this?
–
You received this message because you are subscribed to the Google Groups “Bokeh Discussion - Public” group.
To unsubscribe from this group and stop receiving emails from it, send an email to [email protected].
To post to this group, send email to [email protected].
To view this discussion on the web visit https://groups.google.com/a/continuum.io/d/msgid/bokeh/CAGa_XGEn73TNqbKHPxAjpAPWjSVPUad9xALw9rT3GKpZtohMNQ%40mail.gmail.com.
For more options, visit https://groups.google.com/a/continuum.io/d/optout.
On Feb 28, 2017 7:01 PM, “Sayak Paul” [email protected] wrote:
I don’t Sum(Accuracy) as Y-Label. What Should I do?
On Tue, Feb 28, 2017 at 2:10 PM, Sayak Paul [email protected] wrote:
Hello Bryan.
I don’t want the small squares as shown here: http://bokeh.pydata.org/en/latest/docs/user_guide/charts.html#bar-charts. And in place of numeric values, I want strings in x-axis. What should I do?
–
You received this message because you are subscribed to the Google Groups “Bokeh Discussion - Public” group.
To unsubscribe from this group and stop receiving emails from it, send an email to [email protected].
To post to this group, send email to [email protected].
To view this discussion on the web visit https://groups.google.com/a/continuum.io/d/msgid/bokeh/6ed4193a-9ad7-408f-97ab-9eb587880757%40continuum.io.
For more options, visit https://groups.google.com/a/continuum.io/d/optout.
–
Thanks and Regards,
Sayak Paul,
Placement Representative,
Department of IT,
Netaji Subhash Engineering College,
2013 - 17
Phone: +918981257929
Email-ID: [email protected]
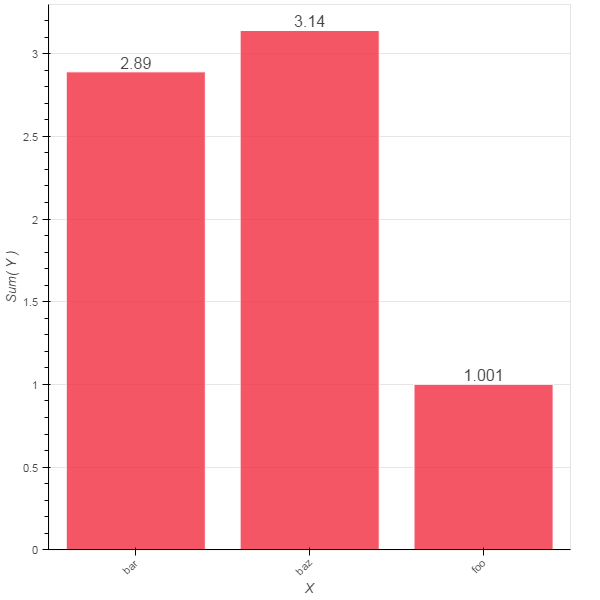
And one more thing. If I want to do add the exact value on top of the bars with respect to each one, what should I do?
On Wed, Mar 1, 2017 at 9:22 AM, Sayak Paul [email protected] wrote:
Thank you very much.
–
On Wed, Mar 1, 2017 at 9:11 AM, Tyler Nickerson [email protected] wrote:
Hi Sayak,
You can remove the legend by passing
legend=Noneto your Bar object when you create your chart. This can also be done after creating your chart by setting the location attribute of the legend attribute toNone. Similarly, you can set your axis labels using either theylabelandxlabelarguments or assigning new values to the corresponding attributes after creating your chart. Setting these values through their arguments is usually easier but, accessing them through the object attributes can be useful too. Here are some examples of what these approaches might look like in code.
Passing arguments to Bar:
my_bar = Bar(..., ylabel='my_y_label', legend=None)Assigning desired values to attributes:
my_bar = Bar(...)
my_bar.yaxis[0].axis_label = 'my_y_label'
my_bar.legend[0].location = None
You can read more about tweaking the appearance of your plot here. This page deals with plots created using the plotting module, but there is a lot of overlap between the plotting and charts modules since charts is just a higher level abstraction of the plotting module. There are also some extra examples for bokeh charts here.
–
You received this message because you are subscribed to the Google Groups “Bokeh Discussion - Public” group.
To unsubscribe from this group and stop receiving emails from it, send an email to [email protected].
To post to this group, send email to [email protected].
To view this discussion on the web visit https://groups.google.com/a/continuum.io/d/msgid/bokeh/CAAd1xFQM6JiR_N2PiWb5BOa6fVudRTLjOMuA%2BLERQG6eiRP92w%40mail.gmail.com.
For more options, visit https://groups.google.com/a/continuum.io/d/optout.
On Tue, Feb 28, 2017 at 6:57 PM, Sayak Paul [email protected] wrote:
Anything onw this?
–
You received this message because you are subscribed to the Google Groups “Bokeh Discussion - Public” group.
To unsubscribe from this group and stop receiving emails from it, send an email to [email protected].
To post to this group, send email to [email protected].
To view this discussion on the web visit https://groups.google.com/a/continuum.io/d/msgid/bokeh/CAGa_XGEn73TNqbKHPxAjpAPWjSVPUad9xALw9rT3GKpZtohMNQ%40mail.gmail.com.
For more options, visit https://groups.google.com/a/continuum.io/d/optout.
On Feb 28, 2017 7:01 PM, “Sayak Paul” [email protected] wrote:
I don’t Sum(Accuracy) as Y-Label. What Should I do?
On Tue, Feb 28, 2017 at 2:10 PM, Sayak Paul [email protected] wrote:
Hello Bryan.
I don’t want the small squares as shown here: http://bokeh.pydata.org/en/latest/docs/user_guide/charts.html#bar-charts. And in place of numeric values, I want strings in x-axis. What should I do?
–
You received this message because you are subscribed to the Google Groups “Bokeh Discussion - Public” group.
To unsubscribe from this group and stop receiving emails from it, send an email to [email protected].
To post to this group, send email to [email protected].
To view this discussion on the web visit https://groups.google.com/a/continuum.io/d/msgid/bokeh/6ed4193a-9ad7-408f-97ab-9eb587880757%40continuum.io.
For more options, visit https://groups.google.com/a/continuum.io/d/optout.
–
Thanks and Regards,
Sayak Paul,
Placement Representative,
Department of IT,
Netaji Subhash Engineering College,
2013 - 17
Phone: +918981257929
Email-ID: [email protected]
I can think of two ways to do this: either adding a text glyph to your bar chart or creating labels using SetLabel model from bokeh.models and adding them to your chart using the add_layout() method. There is info on labels here. Below is an example using SetLabel:
import pandas as pd
from [bokeh.io](http://bokeh.io) import output_file, show
from bokeh.models import ColumnDataSource, LabelSet
from bokeh.charts import Bar
x = ['foo', 'bar', 'baz']
y = [1.001, 2.89, 3.14
]
text = [str(n) for n in y]
df = pd.DataFrame(dict(x=x, y=y, text=text))
bar = Bar(df, label='x', values='y', legend=None
)
# might not be necessary but makes working with LabelSet easier
source = ColumnDataSource(df)
labels = LabelSet(x='x', y='y', text='text', source=source, text_align='center'
)
bar.add_layout(labels)
output_file('test.html'
)
show(bar)
On Tue, Feb 28, 2017 at 7:58 PM, Sayak Paul [email protected] wrote:
And one more thing. If I want to do add the exact value on top of the bars with respect to each one, what should I do?
–
You received this message because you are subscribed to the Google Groups “Bokeh Discussion - Public” group.
To unsubscribe from this group and stop receiving emails from it, send an email to [email protected].
To post to this group, send email to [email protected].
To view this discussion on the web visit https://groups.google.com/a/continuum.io/d/msgid/bokeh/CAGa_XGErKC3O14JqL3kxXRKFcjWHj%3DokP9rBk%2BqYi4EV6ss%2B%2Bg%40mail.gmail.com.
For more options, visit https://groups.google.com/a/continuum.io/d/optout.
On Wed, Mar 1, 2017 at 9:22 AM, Sayak Paul [email protected] wrote:
Thank you very much.
–
On Wed, Mar 1, 2017 at 9:11 AM, Tyler Nickerson [email protected] wrote:
Hi Sayak,
You can remove the legend by passing
legend=Noneto your Bar object when you create your chart. This can also be done after creating your chart by setting the location attribute of the legend attribute toNone. Similarly, you can set your axis labels using either theylabelandxlabelarguments or assigning new values to the corresponding attributes after creating your chart. Setting these values through their arguments is usually easier but, accessing them through the object attributes can be useful too. Here are some examples of what these approaches might look like in code.
Passing arguments to Bar:
my_bar = Bar(..., ylabel='my_y_label', legend=None)Assigning desired values to attributes:
my_bar = Bar(...)
my_bar.yaxis[0].axis_label = 'my_y_label'
my_bar.legend[0].location = None
You can read more about tweaking the appearance of your plot here. This page deals with plots created using the plotting module, but there is a lot of overlap between the plotting and charts modules since charts is just a higher level abstraction of the plotting module. There are also some extra examples for bokeh charts here.
–
You received this message because you are subscribed to the Google Groups “Bokeh Discussion - Public” group.
To unsubscribe from this group and stop receiving emails from it, send an email to [email protected].
To post to this group, send email to [email protected].
To view this discussion on the web visit https://groups.google.com/a/continuum.io/d/msgid/bokeh/CAAd1xFQM6JiR_N2PiWb5BOa6fVudRTLjOMuA%2BLERQG6eiRP92w%40mail.gmail.com.
For more options, visit https://groups.google.com/a/continuum.io/d/optout.
On Tue, Feb 28, 2017 at 6:57 PM, Sayak Paul [email protected] wrote:
Anything onw this?
–
You received this message because you are subscribed to the Google Groups “Bokeh Discussion - Public” group.
To unsubscribe from this group and stop receiving emails from it, send an email to [email protected].
To post to this group, send email to [email protected].
To view this discussion on the web visit https://groups.google.com/a/continuum.io/d/msgid/bokeh/CAGa_XGEn73TNqbKHPxAjpAPWjSVPUad9xALw9rT3GKpZtohMNQ%40mail.gmail.com.
For more options, visit https://groups.google.com/a/continuum.io/d/optout.
On Feb 28, 2017 7:01 PM, “Sayak Paul” [email protected] wrote:
I don’t Sum(Accuracy) as Y-Label. What Should I do?
On Tue, Feb 28, 2017 at 2:10 PM, Sayak Paul [email protected] wrote:
Hello Bryan.
I don’t want the small squares as shown here: http://bokeh.pydata.org/en/latest/docs/user_guide/charts.html#bar-charts. And in place of numeric values, I want strings in x-axis. What should I do?
–
You received this message because you are subscribed to the Google Groups “Bokeh Discussion - Public” group.
To unsubscribe from this group and stop receiving emails from it, send an email to [email protected].
To post to this group, send email to [email protected].
To view this discussion on the web visit https://groups.google.com/a/continuum.io/d/msgid/bokeh/6ed4193a-9ad7-408f-97ab-9eb587880757%40continuum.io.
For more options, visit https://groups.google.com/a/continuum.io/d/optout.
–
Thanks and Regards,
Sayak Paul,
Placement Representative,
Department of IT,
Netaji Subhash Engineering College,
2013 - 17
Phone: +918981257929
Email-ID: [email protected]
Thanks again man.
On Thu, Mar 2, 2017 at 11:59 PM, Tyler Nickerson [email protected] wrote:
I can think of two ways to do this: either adding a text glyph to your bar chart or creating labels using
SetLabelmodel from bokeh.models and adding them to your chart using theadd_layout()method. There is info on labels here. Below is an example usingSetLabel:
import pandas as pd
from [bokeh.io](http://bokeh.io) import output_file, show
from bokeh.models import ColumnDataSource, LabelSet
from bokeh.charts import Bar
x = ['foo', 'bar', 'baz']
y = [1.001, 2.89, 3.14
]
text = [str(n) for n in y]
df = pd.DataFrame(dict(x=x, y=y, text=text))
bar = Bar(df, label='x', values='y', legend=None
)
# might not be necessary but makes working with LabelSet easier
source = ColumnDataSource(df)
labels = LabelSet(x='x', y='y', text='text', source=source, text_align='center'
)
bar.add_layout(labels)
output_file('test.html'
)
show(bar)
–
You received this message because you are subscribed to the Google Groups “Bokeh Discussion - Public” group.
To unsubscribe from this group and stop receiving emails from it, send an email to [email protected].
To post to this group, send email to [email protected].
To view this discussion on the web visit https://groups.google.com/a/continuum.io/d/msgid/bokeh/CAAd1xFThBw_R3oQSrjLfe6J5VG7VMLUkoXy8_9_3kp2TXW6SkA%40mail.gmail.com.
For more options, visit https://groups.google.com/a/continuum.io/d/optout.
–
On Tue, Feb 28, 2017 at 7:58 PM, Sayak Paul [email protected] wrote:
And one more thing. If I want to do add the exact value on top of the bars with respect to each one, what should I do?
–
You received this message because you are subscribed to the Google Groups “Bokeh Discussion - Public” group.
To unsubscribe from this group and stop receiving emails from it, send an email to [email protected].
To post to this group, send email to [email protected].
To view this discussion on the web visit https://groups.google.com/a/continuum.io/d/msgid/bokeh/CAGa_XGErKC3O14JqL3kxXRKFcjWHj%3DokP9rBk%2BqYi4EV6ss%2B%2Bg%40mail.gmail.com.
For more options, visit https://groups.google.com/a/continuum.io/d/optout.
On Wed, Mar 1, 2017 at 9:22 AM, Sayak Paul [email protected] wrote:
Thank you very much.
–
On Wed, Mar 1, 2017 at 9:11 AM, Tyler Nickerson [email protected] wrote:
Hi Sayak,
You can remove the legend by passing
legend=Noneto your Bar object when you create your chart. This can also be done after creating your chart by setting the location attribute of the legend attribute toNone. Similarly, you can set your axis labels using either theylabelandxlabelarguments or assigning new values to the corresponding attributes after creating your chart. Setting these values through their arguments is usually easier but, accessing them through the object attributes can be useful too. Here are some examples of what these approaches might look like in code.
Passing arguments to Bar:
my_bar = Bar(..., ylabel='my_y_label', legend=None)Assigning desired values to attributes:
my_bar = Bar(...)
my_bar.yaxis[0].axis_label = 'my_y_label'
my_bar.legend[0].location = None
You can read more about tweaking the appearance of your plot here. This page deals with plots created using the plotting module, but there is a lot of overlap between the plotting and charts modules since charts is just a higher level abstraction of the plotting module. There are also some extra examples for bokeh charts here.
–
You received this message because you are subscribed to the Google Groups “Bokeh Discussion - Public” group.
To unsubscribe from this group and stop receiving emails from it, send an email to [email protected].
To post to this group, send email to [email protected].
To view this discussion on the web visit https://groups.google.com/a/continuum.io/d/msgid/bokeh/CAAd1xFQM6JiR_N2PiWb5BOa6fVudRTLjOMuA%2BLERQG6eiRP92w%40mail.gmail.com.
For more options, visit https://groups.google.com/a/continuum.io/d/optout.
On Tue, Feb 28, 2017 at 6:57 PM, Sayak Paul [email protected] wrote:
Anything onw this?
–
You received this message because you are subscribed to the Google Groups “Bokeh Discussion - Public” group.
To unsubscribe from this group and stop receiving emails from it, send an email to [email protected].
To post to this group, send email to [email protected].
To view this discussion on the web visit https://groups.google.com/a/continuum.io/d/msgid/bokeh/CAGa_XGEn73TNqbKHPxAjpAPWjSVPUad9xALw9rT3GKpZtohMNQ%40mail.gmail.com.
For more options, visit https://groups.google.com/a/continuum.io/d/optout.
On Feb 28, 2017 7:01 PM, “Sayak Paul” [email protected] wrote:
I don’t Sum(Accuracy) as Y-Label. What Should I do?
On Tue, Feb 28, 2017 at 2:10 PM, Sayak Paul [email protected] wrote:
Hello Bryan.
I don’t want the small squares as shown here: http://bokeh.pydata.org/en/latest/docs/user_guide/charts.html#bar-charts. And in place of numeric values, I want strings in x-axis. What should I do?
–
You received this message because you are subscribed to the Google Groups “Bokeh Discussion - Public” group.
To unsubscribe from this group and stop receiving emails from it, send an email to [email protected].
To post to this group, send email to [email protected].
To view this discussion on the web visit https://groups.google.com/a/continuum.io/d/msgid/bokeh/6ed4193a-9ad7-408f-97ab-9eb587880757%40continuum.io.
For more options, visit https://groups.google.com/a/continuum.io/d/optout.
–
Thanks and Regards,
Sayak Paul,
Placement Representative,
Department of IT,
Netaji Subhash Engineering College,
2013 - 17
Phone: +918981257929
Email-ID: [email protected]
Thanks and Regards,
Sayak Paul,
Placement Representative,
Department of IT,
Netaji Subhash Engineering College,
2013 - 17
Phone: +918981257929
Email-ID: [email protected]
No problem!
On Thu, Mar 2, 2017 at 6:13 PM, Sayak Paul [email protected] wrote:
Thanks again man.
–
You received this message because you are subscribed to the Google Groups “Bokeh Discussion - Public” group.
To unsubscribe from this group and stop receiving emails from it, send an email to [email protected].
To post to this group, send email to [email protected].
To view this discussion on the web visit https://groups.google.com/a/continuum.io/d/msgid/bokeh/CAGa_XGFjFR9BARyHuxWipaXka8QDewN6zvfGg0LQtXNGLot6WA%40mail.gmail.com.
For more options, visit https://groups.google.com/a/continuum.io/d/optout.
On Thu, Mar 2, 2017 at 11:59 PM, Tyler Nickerson [email protected] wrote:
I can think of two ways to do this: either adding a text glyph to your bar chart or creating labels using
SetLabelmodel from bokeh.models and adding them to your chart using theadd_layout()method. There is info on labels here. Below is an example usingSetLabel:
import pandas as pd
from [bokeh.io](http://bokeh.io) import output_file, show
from bokeh.models import ColumnDataSource, LabelSet
from bokeh.charts import Bar
x = ['foo', 'bar', 'baz']
y = [1.001, 2.89, 3.14
]
text = [str(n) for n in y]
df = pd.DataFrame(dict(x=x, y=y, text=text))
bar = Bar(df, label='x', values='y', legend=None
)
# might not be necessary but makes working with LabelSet easier
source = ColumnDataSource(df)
labels = LabelSet(x='x', y='y', text='text', source=source, text_align='center'
)
bar.add_layout(labels)
output_file('test.html'
)
show(bar)
–
You received this message because you are subscribed to the Google Groups “Bokeh Discussion - Public” group.
To unsubscribe from this group and stop receiving emails from it, send an email to [email protected].
To post to this group, send email to [email protected].
To view this discussion on the web visit https://groups.google.com/a/continuum.io/d/msgid/bokeh/CAAd1xFThBw_R3oQSrjLfe6J5VG7VMLUkoXy8_9_3kp2TXW6SkA%40mail.gmail.com.
For more options, visit https://groups.google.com/a/continuum.io/d/optout.
Thanks and Regards,
Sayak Paul,
Placement Representative,
Department of IT,
Netaji Subhash Engineering College,
2013 - 17
Phone: +918981257929
Email-ID: [email protected]
–
On Tue, Feb 28, 2017 at 7:58 PM, Sayak Paul [email protected] wrote:
And one more thing. If I want to do add the exact value on top of the bars with respect to each one, what should I do?
–
You received this message because you are subscribed to the Google Groups “Bokeh Discussion - Public” group.
To unsubscribe from this group and stop receiving emails from it, send an email to [email protected].
To post to this group, send email to [email protected].
To view this discussion on the web visit https://groups.google.com/a/continuum.io/d/msgid/bokeh/CAGa_XGErKC3O14JqL3kxXRKFcjWHj%3DokP9rBk%2BqYi4EV6ss%2B%2Bg%40mail.gmail.com.
For more options, visit https://groups.google.com/a/continuum.io/d/optout.
On Wed, Mar 1, 2017 at 9:22 AM, Sayak Paul [email protected] wrote:
Thank you very much.
–
On Wed, Mar 1, 2017 at 9:11 AM, Tyler Nickerson [email protected] wrote:
Hi Sayak,
You can remove the legend by passing
legend=Noneto your Bar object when you create your chart. This can also be done after creating your chart by setting the location attribute of the legend attribute toNone. Similarly, you can set your axis labels using either theylabelandxlabelarguments or assigning new values to the corresponding attributes after creating your chart. Setting these values through their arguments is usually easier but, accessing them through the object attributes can be useful too. Here are some examples of what these approaches might look like in code.
Passing arguments to Bar:
my_bar = Bar(..., ylabel='my_y_label', legend=None)Assigning desired values to attributes:
my_bar = Bar(...)
my_bar.yaxis[0].axis_label = 'my_y_label'
my_bar.legend[0].location = None
You can read more about tweaking the appearance of your plot here. This page deals with plots created using the plotting module, but there is a lot of overlap between the plotting and charts modules since charts is just a higher level abstraction of the plotting module. There are also some extra examples for bokeh charts here.
–
You received this message because you are subscribed to the Google Groups “Bokeh Discussion - Public” group.
To unsubscribe from this group and stop receiving emails from it, send an email to [email protected].
To post to this group, send email to [email protected].
To view this discussion on the web visit https://groups.google.com/a/continuum.io/d/msgid/bokeh/CAAd1xFQM6JiR_N2PiWb5BOa6fVudRTLjOMuA%2BLERQG6eiRP92w%40mail.gmail.com.
For more options, visit https://groups.google.com/a/continuum.io/d/optout.
On Tue, Feb 28, 2017 at 6:57 PM, Sayak Paul [email protected] wrote:
Anything onw this?
–
You received this message because you are subscribed to the Google Groups “Bokeh Discussion - Public” group.
To unsubscribe from this group and stop receiving emails from it, send an email to [email protected].
To post to this group, send email to [email protected].
To view this discussion on the web visit https://groups.google.com/a/continuum.io/d/msgid/bokeh/CAGa_XGEn73TNqbKHPxAjpAPWjSVPUad9xALw9rT3GKpZtohMNQ%40mail.gmail.com.
For more options, visit https://groups.google.com/a/continuum.io/d/optout.
On Feb 28, 2017 7:01 PM, “Sayak Paul” [email protected] wrote:
I don’t Sum(Accuracy) as Y-Label. What Should I do?
On Tue, Feb 28, 2017 at 2:10 PM, Sayak Paul [email protected] wrote:
Hello Bryan.
I don’t want the small squares as shown here: http://bokeh.pydata.org/en/latest/docs/user_guide/charts.html#bar-charts. And in place of numeric values, I want strings in x-axis. What should I do?
–
You received this message because you are subscribed to the Google Groups “Bokeh Discussion - Public” group.
To unsubscribe from this group and stop receiving emails from it, send an email to [email protected].
To post to this group, send email to [email protected].
To view this discussion on the web visit https://groups.google.com/a/continuum.io/d/msgid/bokeh/6ed4193a-9ad7-408f-97ab-9eb587880757%40continuum.io.
For more options, visit https://groups.google.com/a/continuum.io/d/optout.
–
Thanks and Regards,
Sayak Paul,
Placement Representative,
Department of IT,
Netaji Subhash Engineering College,
2013 - 17
Phone: +918981257929
Email-ID: [email protected]
How to adjust the bar width?
On Sat, Mar 4, 2017 at 6:14 AM, Tyler Nickerson [email protected] wrote:
No problem!
–
You received this message because you are subscribed to the Google Groups “Bokeh Discussion - Public” group.
To unsubscribe from this group and stop receiving emails from it, send an email to [email protected].
To post to this group, send email to [email protected].
To view this discussion on the web visit https://groups.google.com/a/continuum.io/d/msgid/bokeh/CAAd1xFRKHXvjAZJ3CbO1JnhQE%2B8hfYypJf2cjTWs5j2vRNZirA%40mail.gmail.com.
For more options, visit https://groups.google.com/a/continuum.io/d/optout.
–
On Thu, Mar 2, 2017 at 6:13 PM, Sayak Paul [email protected] wrote:
Thanks again man.
–
You received this message because you are subscribed to the Google Groups “Bokeh Discussion - Public” group.
To unsubscribe from this group and stop receiving emails from it, send an email to [email protected].
To post to this group, send email to [email protected].
To view this discussion on the web visit https://groups.google.com/a/continuum.io/d/msgid/bokeh/CAGa_XGFjFR9BARyHuxWipaXka8QDewN6zvfGg0LQtXNGLot6WA%40mail.gmail.com.
For more options, visit https://groups.google.com/a/continuum.io/d/optout.
On Thu, Mar 2, 2017 at 11:59 PM, Tyler Nickerson [email protected] wrote:
I can think of two ways to do this: either adding a text glyph to your bar chart or creating labels using
SetLabelmodel from bokeh.models and adding them to your chart using theadd_layout()method. There is info on labels here. Below is an example usingSetLabel:
import pandas as pd
from [bokeh.io](http://bokeh.io) import output_file, show
from bokeh.models import ColumnDataSource, LabelSet
from bokeh.charts import Bar
x = ['foo', 'bar', 'baz']
y = [1.001, 2.89, 3.14
]
text = [str(n) for n in y]
df = pd.DataFrame(dict(x=x, y=y, text=text))
bar = Bar(df, label='x', values='y', legend=None
)
# might not be necessary but makes working with LabelSet easier
source = ColumnDataSource(df)
labels = LabelSet(x='x', y='y', text='text', source=source, text_align='center'
)
bar.add_layout(labels)
output_file('test.html'
)
show(bar)
–
You received this message because you are subscribed to the Google Groups “Bokeh Discussion - Public” group.
To unsubscribe from this group and stop receiving emails from it, send an email to [email protected].
To post to this group, send email to [email protected].
To view this discussion on the web visit https://groups.google.com/a/continuum.io/d/msgid/bokeh/CAAd1xFThBw_R3oQSrjLfe6J5VG7VMLUkoXy8_9_3kp2TXW6SkA%40mail.gmail.com.
For more options, visit https://groups.google.com/a/continuum.io/d/optout.
Thanks and Regards,
Sayak Paul,
Placement Representative,
Department of IT,
Netaji Subhash Engineering College,
2013 - 17
Phone: +918981257929
Email-ID: [email protected]
–
On Tue, Feb 28, 2017 at 7:58 PM, Sayak Paul [email protected] wrote:
And one more thing. If I want to do add the exact value on top of the bars with respect to each one, what should I do?
–
You received this message because you are subscribed to the Google Groups “Bokeh Discussion - Public” group.
To unsubscribe from this group and stop receiving emails from it, send an email to [email protected].
To post to this group, send email to [email protected].
To view this discussion on the web visit https://groups.google.com/a/continuum.io/d/msgid/bokeh/CAGa_XGErKC3O14JqL3kxXRKFcjWHj%3DokP9rBk%2BqYi4EV6ss%2B%2Bg%40mail.gmail.com.
For more options, visit https://groups.google.com/a/continuum.io/d/optout.
On Wed, Mar 1, 2017 at 9:22 AM, Sayak Paul [email protected] wrote:
Thank you very much.
–
On Wed, Mar 1, 2017 at 9:11 AM, Tyler Nickerson [email protected] wrote:
Hi Sayak,
You can remove the legend by passing
legend=Noneto your Bar object when you create your chart. This can also be done after creating your chart by setting the location attribute of the legend attribute toNone. Similarly, you can set your axis labels using either theylabelandxlabelarguments or assigning new values to the corresponding attributes after creating your chart. Setting these values through their arguments is usually easier but, accessing them through the object attributes can be useful too. Here are some examples of what these approaches might look like in code.
Passing arguments to Bar:
my_bar = Bar(..., ylabel='my_y_label', legend=None)Assigning desired values to attributes:
my_bar = Bar(...)
my_bar.yaxis[0].axis_label = 'my_y_label'
my_bar.legend[0].location = None
You can read more about tweaking the appearance of your plot here. This page deals with plots created using the plotting module, but there is a lot of overlap between the plotting and charts modules since charts is just a higher level abstraction of the plotting module. There are also some extra examples for bokeh charts here.
–
You received this message because you are subscribed to the Google Groups “Bokeh Discussion - Public” group.
To unsubscribe from this group and stop receiving emails from it, send an email to [email protected].
To post to this group, send email to [email protected].
To view this discussion on the web visit https://groups.google.com/a/continuum.io/d/msgid/bokeh/CAAd1xFQM6JiR_N2PiWb5BOa6fVudRTLjOMuA%2BLERQG6eiRP92w%40mail.gmail.com.
For more options, visit https://groups.google.com/a/continuum.io/d/optout.
On Tue, Feb 28, 2017 at 6:57 PM, Sayak Paul [email protected] wrote:
Anything onw this?
–
You received this message because you are subscribed to the Google Groups “Bokeh Discussion - Public” group.
To unsubscribe from this group and stop receiving emails from it, send an email to [email protected].
To post to this group, send email to [email protected].
To view this discussion on the web visit https://groups.google.com/a/continuum.io/d/msgid/bokeh/CAGa_XGEn73TNqbKHPxAjpAPWjSVPUad9xALw9rT3GKpZtohMNQ%40mail.gmail.com.
For more options, visit https://groups.google.com/a/continuum.io/d/optout.
On Feb 28, 2017 7:01 PM, “Sayak Paul” [email protected] wrote:
I don’t Sum(Accuracy) as Y-Label. What Should I do?
On Tue, Feb 28, 2017 at 2:10 PM, Sayak Paul [email protected] wrote:
Hello Bryan.
I don’t want the small squares as shown here: http://bokeh.pydata.org/en/latest/docs/user_guide/charts.html#bar-charts. And in place of numeric values, I want strings in x-axis. What should I do?
–
You received this message because you are subscribed to the Google Groups “Bokeh Discussion - Public” group.
To unsubscribe from this group and stop receiving emails from it, send an email to [email protected].
To post to this group, send email to [email protected].
To view this discussion on the web visit https://groups.google.com/a/continuum.io/d/msgid/bokeh/6ed4193a-9ad7-408f-97ab-9eb587880757%40continuum.io.
For more options, visit https://groups.google.com/a/continuum.io/d/optout.
–
Thanks and Regards,
Sayak Paul,
Placement Representative,
Department of IT,
Netaji Subhash Engineering College,
2013 - 17
Phone: +918981257929
Email-ID: [email protected]
Thanks and Regards,
Sayak Paul,
Placement Representative,
Department of IT,
Netaji Subhash Engineering College,
2013 - 17
Phone: +918981257929
Email-ID: [email protected]
You can adjust the bar width with the bar_width parameter. bar_width takes a float value between 0 and 1 that represents the ratio of the bar’s width relative to the total space allocated for the bar when the chart is made. There is some more info on bar charts and other features of the charts module here and here.
On Sat, Mar 4, 2017 at 10:38 PM, Sayak Paul [email protected] wrote:
How to adjust the bar width?
–
You received this message because you are subscribed to the Google Groups “Bokeh Discussion - Public” group.
To unsubscribe from this group and stop receiving emails from it, send an email to [email protected].
To post to this group, send email to [email protected].
To view this discussion on the web visit https://groups.google.com/a/continuum.io/d/msgid/bokeh/CAGa_XGGMu0E3DdamSL3cWZepTOLmgr09W0BrFR8Dj4Ouzpg1Vg%40mail.gmail.com.
For more options, visit https://groups.google.com/a/continuum.io/d/optout.
On Sat, Mar 4, 2017 at 6:14 AM, Tyler Nickerson [email protected] wrote:
No problem!
–
You received this message because you are subscribed to the Google Groups “Bokeh Discussion - Public” group.
To unsubscribe from this group and stop receiving emails from it, send an email to [email protected].
To post to this group, send email to [email protected].
To view this discussion on the web visit https://groups.google.com/a/continuum.io/d/msgid/bokeh/CAAd1xFRKHXvjAZJ3CbO1JnhQE%2B8hfYypJf2cjTWs5j2vRNZirA%40mail.gmail.com.
For more options, visit https://groups.google.com/a/continuum.io/d/optout.
–
Thanks and Regards,
Sayak Paul,
Placement Representative,
Department of IT,
Netaji Subhash Engineering College,
2013 - 17
Phone: +918981257929
Email-ID: [email protected]
On Thu, Mar 2, 2017 at 6:13 PM, Sayak Paul [email protected] wrote:
Thanks again man.
–
You received this message because you are subscribed to the Google Groups “Bokeh Discussion - Public” group.
To unsubscribe from this group and stop receiving emails from it, send an email to [email protected].
To post to this group, send email to [email protected].
To view this discussion on the web visit https://groups.google.com/a/continuum.io/d/msgid/bokeh/CAGa_XGFjFR9BARyHuxWipaXka8QDewN6zvfGg0LQtXNGLot6WA%40mail.gmail.com.
For more options, visit https://groups.google.com/a/continuum.io/d/optout.
On Thu, Mar 2, 2017 at 11:59 PM, Tyler Nickerson [email protected] wrote:
I can think of two ways to do this: either adding a text glyph to your bar chart or creating labels using
SetLabelmodel from bokeh.models and adding them to your chart using theadd_layout()method. There is info on labels here. Below is an example usingSetLabel:
import pandas as pd
from [bokeh.io](http://bokeh.io) import output_file, show
from bokeh.models import ColumnDataSource, LabelSet
from bokeh.charts import Bar
x = ['foo', 'bar', 'baz']
y = [1.001, 2.89, 3.14
]
text = [str(n) for n in y]
df = pd.DataFrame(dict(x=x, y=y, text=text))
bar = Bar(df, label='x', values='y', legend=None
)
# might not be necessary but makes working with LabelSet easier
source = ColumnDataSource(df)
labels = LabelSet(x='x', y='y', text='text', source=source, text_align='center'
)
bar.add_layout(labels)
output_file('test.html'
)
show(bar)
–
You received this message because you are subscribed to the Google Groups “Bokeh Discussion - Public” group.
To unsubscribe from this group and stop receiving emails from it, send an email to [email protected].
To post to this group, send email to [email protected].
To view this discussion on the web visit https://groups.google.com/a/continuum.io/d/msgid/bokeh/CAAd1xFThBw_R3oQSrjLfe6J5VG7VMLUkoXy8_9_3kp2TXW6SkA%40mail.gmail.com.
For more options, visit https://groups.google.com/a/continuum.io/d/optout.
Thanks and Regards,
Sayak Paul,
Placement Representative,
Department of IT,
Netaji Subhash Engineering College,
2013 - 17
Phone: +918981257929
Email-ID: [email protected]
–
On Tue, Feb 28, 2017 at 7:58 PM, Sayak Paul [email protected] wrote:
And one more thing. If I want to do add the exact value on top of the bars with respect to each one, what should I do?
–
You received this message because you are subscribed to the Google Groups “Bokeh Discussion - Public” group.
To unsubscribe from this group and stop receiving emails from it, send an email to [email protected].
To post to this group, send email to [email protected].
To view this discussion on the web visit https://groups.google.com/a/continuum.io/d/msgid/bokeh/CAGa_XGErKC3O14JqL3kxXRKFcjWHj%3DokP9rBk%2BqYi4EV6ss%2B%2Bg%40mail.gmail.com.
For more options, visit https://groups.google.com/a/continuum.io/d/optout.
On Wed, Mar 1, 2017 at 9:22 AM, Sayak Paul [email protected] wrote:
Thank you very much.
–
On Wed, Mar 1, 2017 at 9:11 AM, Tyler Nickerson [email protected] wrote:
Hi Sayak,
You can remove the legend by passing
legend=Noneto your Bar object when you create your chart. This can also be done after creating your chart by setting the location attribute of the legend attribute toNone. Similarly, you can set your axis labels using either theylabelandxlabelarguments or assigning new values to the corresponding attributes after creating your chart. Setting these values through their arguments is usually easier but, accessing them through the object attributes can be useful too. Here are some examples of what these approaches might look like in code.
Passing arguments to Bar:
my_bar = Bar(..., ylabel='my_y_label', legend=None)Assigning desired values to attributes:
my_bar = Bar(...)
my_bar.yaxis[0].axis_label = 'my_y_label'
my_bar.legend[0].location = None
You can read more about tweaking the appearance of your plot here. This page deals with plots created using the plotting module, but there is a lot of overlap between the plotting and charts modules since charts is just a higher level abstraction of the plotting module. There are also some extra examples for bokeh charts here.
–
You received this message because you are subscribed to the Google Groups “Bokeh Discussion - Public” group.
To unsubscribe from this group and stop receiving emails from it, send an email to [email protected].
To post to this group, send email to [email protected].
To view this discussion on the web visit https://groups.google.com/a/continuum.io/d/msgid/bokeh/CAAd1xFQM6JiR_N2PiWb5BOa6fVudRTLjOMuA%2BLERQG6eiRP92w%40mail.gmail.com.
For more options, visit https://groups.google.com/a/continuum.io/d/optout.
On Tue, Feb 28, 2017 at 6:57 PM, Sayak Paul [email protected] wrote:
Anything onw this?
–
You received this message because you are subscribed to the Google Groups “Bokeh Discussion - Public” group.
To unsubscribe from this group and stop receiving emails from it, send an email to [email protected].
To post to this group, send email to [email protected].
To view this discussion on the web visit https://groups.google.com/a/continuum.io/d/msgid/bokeh/CAGa_XGEn73TNqbKHPxAjpAPWjSVPUad9xALw9rT3GKpZtohMNQ%40mail.gmail.com.
For more options, visit https://groups.google.com/a/continuum.io/d/optout.
On Feb 28, 2017 7:01 PM, “Sayak Paul” [email protected] wrote:
I don’t Sum(Accuracy) as Y-Label. What Should I do?
On Tue, Feb 28, 2017 at 2:10 PM, Sayak Paul [email protected] wrote:
Hello Bryan.
I don’t want the small squares as shown here: http://bokeh.pydata.org/en/latest/docs/user_guide/charts.html#bar-charts. And in place of numeric values, I want strings in x-axis. What should I do?
–
You received this message because you are subscribed to the Google Groups “Bokeh Discussion - Public” group.
To unsubscribe from this group and stop receiving emails from it, send an email to [email protected].
To post to this group, send email to [email protected].
To view this discussion on the web visit https://groups.google.com/a/continuum.io/d/msgid/bokeh/6ed4193a-9ad7-408f-97ab-9eb587880757%40continuum.io.
For more options, visit https://groups.google.com/a/continuum.io/d/optout.
–
Thanks and Regards,
Sayak Paul,
Placement Representative,
Department of IT,
Netaji Subhash Engineering College,
2013 - 17
Phone: +918981257929
Email-ID: [email protected]
Thank you very much.
Regards,
Sayak Paul
On Mar 6, 2017 11:57 AM, “Tyler Nickerson” [email protected] wrote:
You can adjust the bar width with the
bar_widthparameter.bar_widthtakes a float value between 0 and 1 that represents the ratio of the bar’s width relative to the total space allocated for the bar when the chart is made. There is some more info on bar charts and other features of the charts module here and here.
–
You received this message because you are subscribed to the Google Groups “Bokeh Discussion - Public” group.
To unsubscribe from this group and stop receiving emails from it, send an email to [email protected].
To post to this group, send email to [email protected].
To view this discussion on the web visit https://groups.google.com/a/continuum.io/d/msgid/bokeh/CAAd1xFR4YH5z87oW_HWXNL9O_sA8PtqGESXWbrU1OasHUq-x3Q%40mail.gmail.com.
For more options, visit https://groups.google.com/a/continuum.io/d/optout.
On Sat, Mar 4, 2017 at 10:38 PM, Sayak Paul [email protected] wrote:
How to adjust the bar width?
–
You received this message because you are subscribed to the Google Groups “Bokeh Discussion - Public” group.
To unsubscribe from this group and stop receiving emails from it, send an email to [email protected].
To post to this group, send email to [email protected].
To view this discussion on the web visit https://groups.google.com/a/continuum.io/d/msgid/bokeh/CAGa_XGGMu0E3DdamSL3cWZepTOLmgr09W0BrFR8Dj4Ouzpg1Vg%40mail.gmail.com.
For more options, visit https://groups.google.com/a/continuum.io/d/optout.
On Sat, Mar 4, 2017 at 6:14 AM, Tyler Nickerson [email protected] wrote:
No problem!
–
You received this message because you are subscribed to the Google Groups “Bokeh Discussion - Public” group.
To unsubscribe from this group and stop receiving emails from it, send an email to [email protected].
To post to this group, send email to [email protected].
To view this discussion on the web visit https://groups.google.com/a/continuum.io/d/msgid/bokeh/CAAd1xFRKHXvjAZJ3CbO1JnhQE%2B8hfYypJf2cjTWs5j2vRNZirA%40mail.gmail.com.
For more options, visit https://groups.google.com/a/continuum.io/d/optout.
–
Thanks and Regards,
Sayak Paul,
Placement Representative,
Department of IT,
Netaji Subhash Engineering College,
2013 - 17
Phone: +918981257929
Email-ID: [email protected]
On Thu, Mar 2, 2017 at 6:13 PM, Sayak Paul [email protected] wrote:
Thanks again man.
–
You received this message because you are subscribed to the Google Groups “Bokeh Discussion - Public” group.
To unsubscribe from this group and stop receiving emails from it, send an email to [email protected].
To post to this group, send email to [email protected].
To view this discussion on the web visit https://groups.google.com/a/continuum.io/d/msgid/bokeh/CAGa_XGFjFR9BARyHuxWipaXka8QDewN6zvfGg0LQtXNGLot6WA%40mail.gmail.com.
For more options, visit https://groups.google.com/a/continuum.io/d/optout.
On Thu, Mar 2, 2017 at 11:59 PM, Tyler Nickerson [email protected] wrote:
I can think of two ways to do this: either adding a text glyph to your bar chart or creating labels using
SetLabelmodel from bokeh.models and adding them to your chart using theadd_layout()method. There is info on labels here. Below is an example usingSetLabel:
import pandas as pd
from [bokeh.io](http://bokeh.io) import output_file, show
from bokeh.models import ColumnDataSource, LabelSet
from bokeh.charts import Bar
x = ['foo', 'bar', 'baz']
y = [1.001, 2.89, 3.14
]
text = [str(n) for n in y]
df = pd.DataFrame(dict(x=x, y=y, text=text))
bar = Bar(df, label='x', values='y', legend=None
)
# might not be necessary but makes working with LabelSet easier
source = ColumnDataSource(df)
labels = LabelSet(x='x', y='y', text='text', source=source, text_align='center'
)
bar.add_layout(labels)
output_file('test.html'
)
show(bar)
–
You received this message because you are subscribed to the Google Groups “Bokeh Discussion - Public” group.
To unsubscribe from this group and stop receiving emails from it, send an email to [email protected].
To post to this group, send email to [email protected].
To view this discussion on the web visit https://groups.google.com/a/continuum.io/d/msgid/bokeh/CAAd1xFThBw_R3oQSrjLfe6J5VG7VMLUkoXy8_9_3kp2TXW6SkA%40mail.gmail.com.
For more options, visit https://groups.google.com/a/continuum.io/d/optout.
Thanks and Regards,
Sayak Paul,
Placement Representative,
Department of IT,
Netaji Subhash Engineering College,
2013 - 17
Phone: +918981257929
Email-ID: [email protected]
–
On Tue, Feb 28, 2017 at 7:58 PM, Sayak Paul [email protected] wrote:
And one more thing. If I want to do add the exact value on top of the bars with respect to each one, what should I do?
–
You received this message because you are subscribed to the Google Groups “Bokeh Discussion - Public” group.
To unsubscribe from this group and stop receiving emails from it, send an email to [email protected].
To post to this group, send email to [email protected].
To view this discussion on the web visit https://groups.google.com/a/continuum.io/d/msgid/bokeh/CAGa_XGErKC3O14JqL3kxXRKFcjWHj%3DokP9rBk%2BqYi4EV6ss%2B%2Bg%40mail.gmail.com.
For more options, visit https://groups.google.com/a/continuum.io/d/optout.
On Wed, Mar 1, 2017 at 9:22 AM, Sayak Paul [email protected] wrote:
Thank you very much.
–
On Wed, Mar 1, 2017 at 9:11 AM, Tyler Nickerson [email protected] wrote:
Hi Sayak,
You can remove the legend by passing
legend=Noneto your Bar object when you create your chart. This can also be done after creating your chart by setting the location attribute of the legend attribute toNone. Similarly, you can set your axis labels using either theylabelandxlabelarguments or assigning new values to the corresponding attributes after creating your chart. Setting these values through their arguments is usually easier but, accessing them through the object attributes can be useful too. Here are some examples of what these approaches might look like in code.
Passing arguments to Bar:
my_bar = Bar(..., ylabel='my_y_label', legend=None)Assigning desired values to attributes:
my_bar = Bar(...)
my_bar.yaxis[0].axis_label = 'my_y_label'
my_bar.legend[0].location = None
You can read more about tweaking the appearance of your plot here. This page deals with plots created using the plotting module, but there is a lot of overlap between the plotting and charts modules since charts is just a higher level abstraction of the plotting module. There are also some extra examples for bokeh charts here.
–
You received this message because you are subscribed to the Google Groups “Bokeh Discussion - Public” group.
To unsubscribe from this group and stop receiving emails from it, send an email to [email protected].
To post to this group, send email to [email protected].
To view this discussion on the web visit https://groups.google.com/a/continuum.io/d/msgid/bokeh/CAAd1xFQM6JiR_N2PiWb5BOa6fVudRTLjOMuA%2BLERQG6eiRP92w%40mail.gmail.com.
For more options, visit https://groups.google.com/a/continuum.io/d/optout.
On Tue, Feb 28, 2017 at 6:57 PM, Sayak Paul [email protected] wrote:
Anything onw this?
–
You received this message because you are subscribed to the Google Groups “Bokeh Discussion - Public” group.
To unsubscribe from this group and stop receiving emails from it, send an email to [email protected].
To post to this group, send email to [email protected].
To view this discussion on the web visit https://groups.google.com/a/continuum.io/d/msgid/bokeh/CAGa_XGEn73TNqbKHPxAjpAPWjSVPUad9xALw9rT3GKpZtohMNQ%40mail.gmail.com.
For more options, visit https://groups.google.com/a/continuum.io/d/optout.
On Feb 28, 2017 7:01 PM, “Sayak Paul” [email protected] wrote:
I don’t Sum(Accuracy) as Y-Label. What Should I do?
On Tue, Feb 28, 2017 at 2:10 PM, Sayak Paul [email protected] wrote:
Hello Bryan.
I don’t want the small squares as shown here: http://bokeh.pydata.org/en/latest/docs/user_guide/charts.html#bar-charts. And in place of numeric values, I want strings in x-axis. What should I do?
–
You received this message because you are subscribed to the Google Groups “Bokeh Discussion - Public” group.
To unsubscribe from this group and stop receiving emails from it, send an email to [email protected].
To post to this group, send email to [email protected].
To view this discussion on the web visit https://groups.google.com/a/continuum.io/d/msgid/bokeh/6ed4193a-9ad7-408f-97ab-9eb587880757%40continuum.io.
For more options, visit https://groups.google.com/a/continuum.io/d/optout.
–
Thanks and Regards,
Sayak Paul,
Placement Representative,
Department of IT,
Netaji Subhash Engineering College,
2013 - 17
Phone: +918981257929
Email-ID: [email protected]