I’m trying to set the surface color to something other than the z axis values but the surface color does not change.
The example from bokeh/examples/app/surface3d at branch-3.0 · bokeh/bokeh · GitHub has the lines:
value = np.sin(xx/50) * np.cos(yy/50) * 50 + 50
``
source = ColumnDataSource(data=dict(x=xx, y=yy, z=value, color=value))
surface = Surface3d(x=“x”, y=“y”, z=“z”, color=“color”, data_source=source, width=600, height=600)
I’ve updated as follows:
value = np.sin(xx/50) * np.cos(yy/50) * 50 + 50
color = np.linspace(0, 1, value.shape[0])
source = ColumnDataSource(data=dict(x=xx, y=yy, z=value, color=color))
surface = Surface3d(x=“x”, y=“y”, z=“z”, color=“color”, data_source=source, width=600, height=600)
``
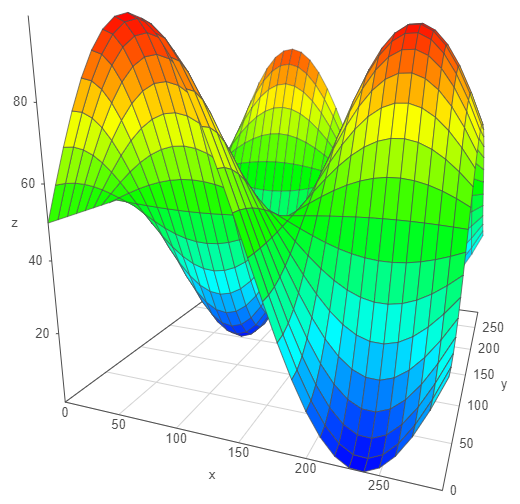
But the image remains the same as the attached png.
Version Info
···
Python version 2.7.13
Anaconda2 Distribution 4.4.0 Community Edition
Bokeh version 0.12.5
nodejs version 9.11.0
Windows 8.1 Pro (Build 9600)
Chrome Version 65.0.3325.181 (Official Build) (64-bit)