Hi,
I am using a FreehandDrawTool to draw on an image, the image has two channel and I wanna jump between the channels.
Two methods that I’ve tried:
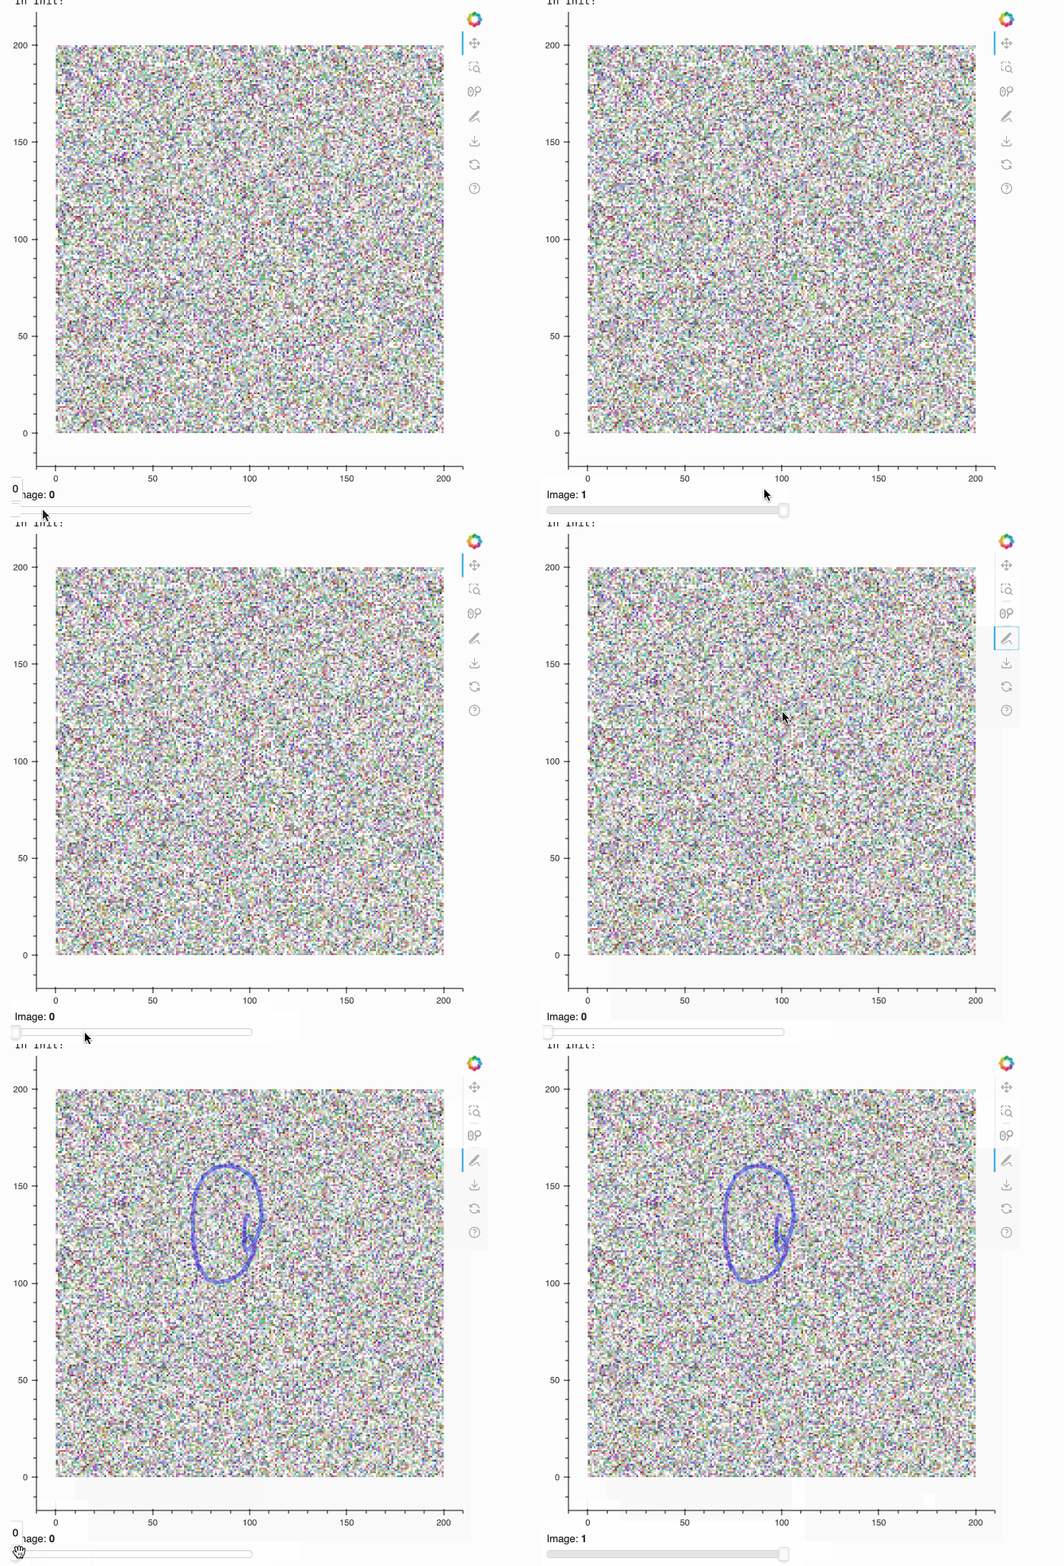
- Jump between channels using slider:
import numpy as np  # last update 18/3/23
from bokeh.models import (FreehandDrawTool, PolyDrawTool, PolyEditTool,
                          TabPanel, Tabs)
from bokeh.plotting import figure, output_notebook, show
from PIL import Image, ImageEnhance, ImageFilter
from bokeh.layouts import column
from bokeh.models import Slider, CustomJS

output_notebook()


# create images
imarray =  np.random.randint(1,224,size=(200,200,4)).astype('uint8')
rand_im1 = imarray.view("uint32").reshape(imarray.shape[:2])

imarray =  np.random.randint(1,224,size=(200,200,4)).astype('uint8')
rand_im2 = imarray.view("uint32").reshape(imarray.shape[:2])

# create the plot and image renderer
p = figure(width=600,height=600,match_aspect=True)
image_renderer = p.image_rgba(image=[rand_im1], x=0, y=0, dw=imarray.shape[1], dh=imarray.shape[0])
render_dict1 = p.multi_line([], [], line_width=5, alpha=0.4, color='blue')
draw_tool_dict1 = FreehandDrawTool(renderers=[render_dict1], num_objects=50)
p.add_tools(draw_tool_dict1)
# create the slider
slider = Slider(start=0, end=1, step=1, value=0, title='Image')

# define the JavaScript callback function for the slider
callback = CustomJS(args=dict(image_renderer=image_renderer, rand_im1=rand_im1, rand_im2=rand_im2), code="""
    if (cb_obj.value == 0) {
        image_renderer.data_source.data['image'] = [rand_im1];
    } else {
        image_renderer.data_source.data['image'] = [rand_im2];
    }
    image_renderer.change.emit();
""")

# attach the callback function to the slider
slider.js_on_change('value', callback)

# create a layout for the plot and slider
layout = column(p, slider)

# show the plot and slider
show(layout)
It does not change the data when I play with the sliders:

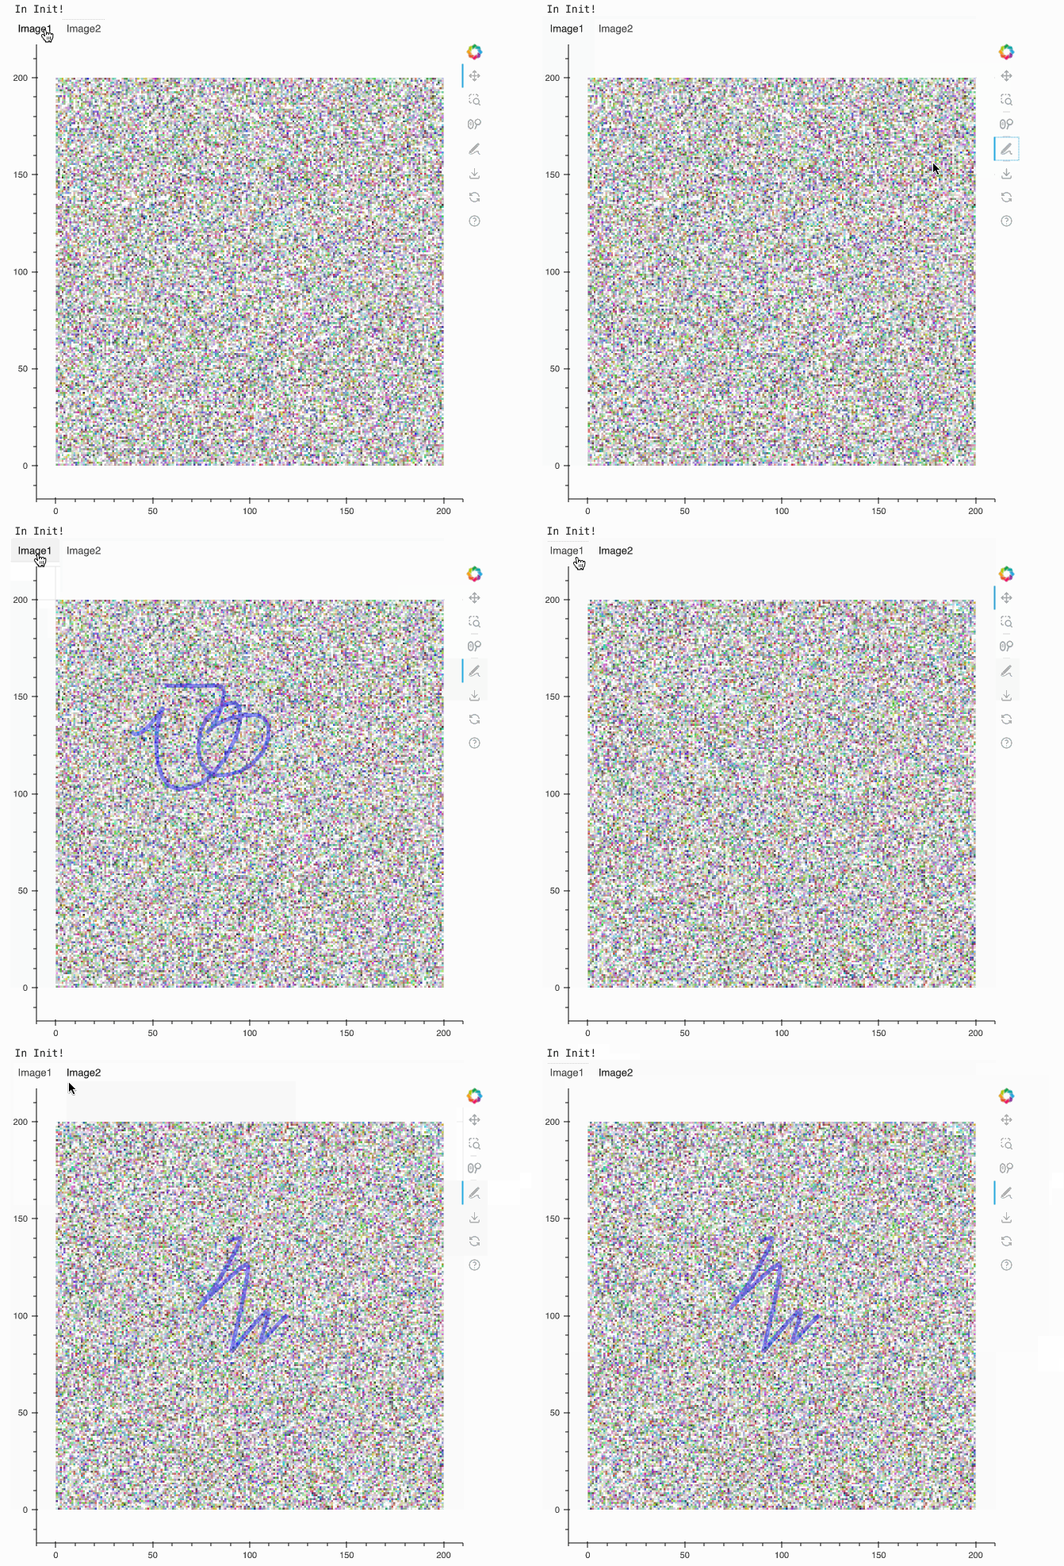
- Using Tabs:
import numpy as np  # last update 18/3/23
from bokeh.models import (FreehandDrawTool, PolyDrawTool, PolyEditTool,
                          TabPanel, Tabs)
from bokeh.plotting import figure, output_notebook, show
from PIL import Image, ImageEnhance, ImageFilter

output_notebook()


# create images
imarray =  np.random.randint(1,224,size=(200,200,4)).astype('uint8')
rand_im1 = imarray.view("uint32").reshape(imarray.shape[:2])

imarray =  np.random.randint(1,224,size=(200,200,4)).astype('uint8')
rand_im2 = imarray.view("uint32").reshape(imarray.shape[:2])

p1 = figure(width=600,height=600,match_aspect=True)
plotted_image1 = p1.image_rgba(image=[rand_im1], x=0, y=0, dw=imarray.shape[1], dh=imarray.shape[0])
render_dict1 = p1.multi_line([], [], line_width=5, alpha=0.4, color='blue')
draw_tool_dict1 = FreehandDrawTool(renderers=[render_dict1], num_objects=50)
p1.add_tools(draw_tool_dict1)
tab1 = TabPanel(child=p1, title="Image1")

p2 = figure(width=600,height=600,match_aspect=True, x_range=p1.x_range,y_range=p1.y_range)
plotted_image2 = p2.image_rgba(image=[rand_im2], x=0, y=0, dw=imarray.shape[1], dh=imarray.shape[0])
render_dict2 = p2.multi_line([], [], line_width=5, alpha=0.4, color='blue')
draw_tool_dict2 = FreehandDrawTool(renderers=[render_dict2], num_objects=50)
p2.add_tools(draw_tool_dict2)
tab2 = TabPanel(child=p2, title="Image2")

tabs = Tabs(tabs=[tab1, tab2])

show(tabs)
This indeed change the output, but it does not keep the drawing.

Any help will be appreciated, thanks!