With Bokeh 2.4 when we had lots of tabs we’d get a little scroll widget, when there were too many tab headers to fit horizontally on the page like this:
![]()
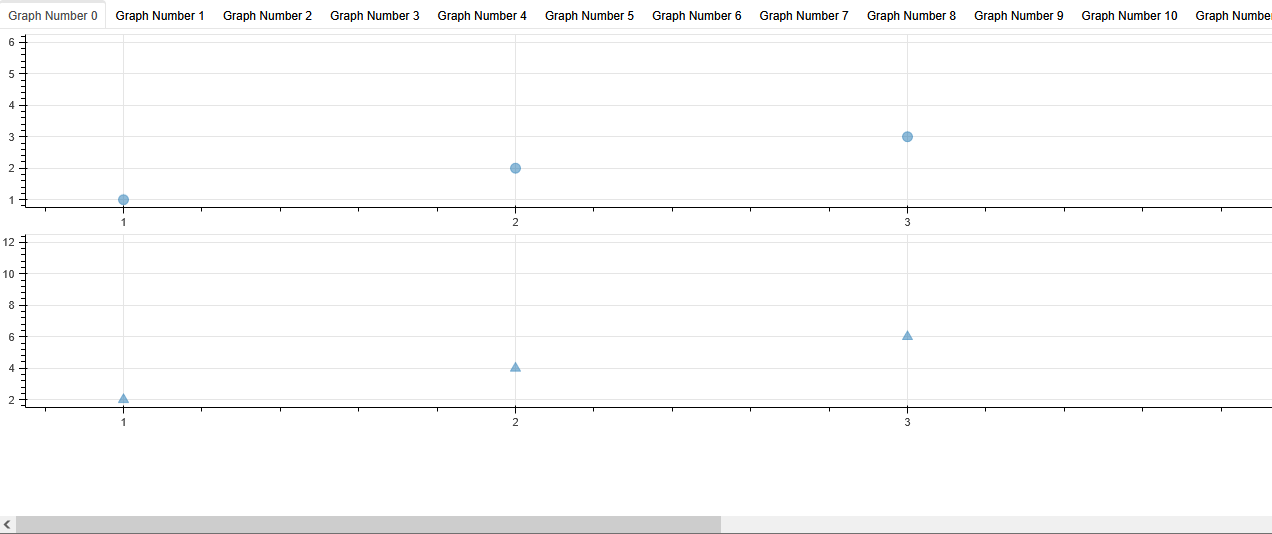
With Bokeh 3.6 we don’t seem to get that behaviour. The tab headers are all laid out in a horizontal row. This means the figure can’t fit on the screen so there’s a scrollbar in the browser. This in turn means that the graphs on the tabs get stretched so they don’t all fit on the screen.
Is there a way to get something like the old behaviour?
Pic with Bokeh 3.6:
Code to produce this
from bokeh.io import output_file, show
from bokeh.layouts import row, column
from bokeh.models import Div, Tabs, TabPanel
from bokeh.plotting import figure

x = [1, 2, 3, 4, 5, 6]
y0 = x
y1 = [i * 2 for i in x]
y2 = [i ** 2 for i in x]

# create a new plot
s1 = figure(width=200, height=200, sizing_mode='stretch_width')
s1.circle(x, y0, size=10, alpha=0.5)

# create another one
s2 = figure(width=200, height=200, sizing_mode='stretch_width')
s2.triangle(x, y1, size=10, alpha=0.5)

layout_titles = [f"Graph Number {i}" for i in range(20)]
graph_panels = [TabPanel(child=column(children=[Div(text='Loading...')], sizing_mode='stretch_width'),
                      title=layout_title) for layout_title in layout_titles]

# populate just the first active tab's column with its graph layout content
graph_panels[0].child.children = [s1, s2]

tab_layout = Tabs(tabs=graph_panels, sizing_mode='stretch_width')

# show the results
show(tab_layout)