I have a table with one row which I am trying to flip (from being horizontal to vertical) and then shown with the columns and values being paired in two columns. I am not sure how to do either of these though. I added a screen capture of a table in excel to show what I hope the end product would look like.
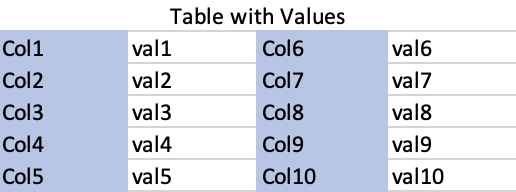
Below is what I want my table to look like:
This is what my code produces:

Below is my code:
from bokeh.io import show
from bokeh.models.widgets import DataTable, DateFormatter, TableColumn
import pandas as pd

df_dict = {}
for i in range(10):
    col = 'col:' + str(i)
    val = 'val:'+ str(i)
    df_dict.update({col:val})

df = pd.DataFrame([df_dict])


def create_table(df):
    Columns = [TableColumn(field=Ci, title=Ci) for Ci in df.columns] # bokeh columns
    data_table = DataTable(columns=Columns, source=ColumnDataSource(df)) # bokeh table
    return data_table

p = create_table(df)

show(p)