Hello and thank you so much for developing Bokeh!
I posted this question also on Stackoverflow:
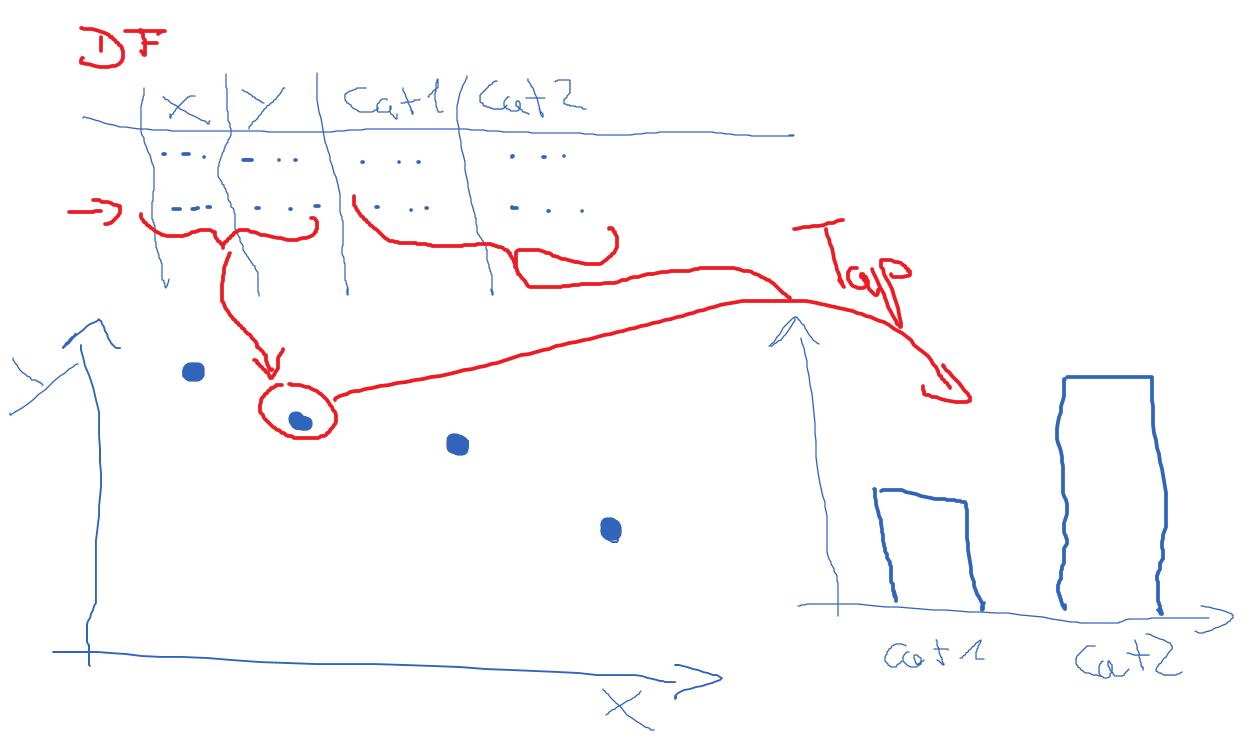
I have a DataFrame which holds the data I want to plot in a scatter plot. The DataFrame has far more information than only the columns needed for the scatter x and y data.
I want to show the additional data as hover (which is not the problem) but also if I Tap-select one data point in the scatter the additional data in the other columns of the ColumnDataSource shall be plottet in a Bar Plot.
My problem is to get the bar plot to accept the data stored in the one selected row of the ColumnDataSource. Everything I have seen uses column based data to feed it to the bar plot.
I stripped my Problem down to a minimalistic code snippet:
SRC = ColumnDataSource(df)

def Plot(doc):

    def callback(event):
        SELECTED = SRC.selected.indices
        bplot = make_bPlot(SELECTED)

    def make_bPlot(selected):
        #Here is my question:
        #How to feed the row-wise data of the SRC to the barplot?
        b = figure(x_range=["cat1", "cat2"])
        b.vbar(x=["cat1", "cat2"], top=["cat1", "cat2"], source=SRC)

        return b

    TOOLTIPS = [
        ("x", "@x"),
        ("y", "@y"),
        ("Category 1", "@cat1"),
        ("Category 2", "@cat2")]

    TOOLS="pan,wheel_zoom,zoom_in,zoom_out,box_zoom,reset,tap"
    cplot = figure(tools = TOOLS, tooltips=TOOLTIPS)
    cplot.circle("x", "y", source=SRC)

    bplot = make_bPlot(None) # init


    taptool = plot.select(type=TapTool)
    cplot.on_event(Tap, callback)


    layout = column(cplot, bplot)
    doc.add_root(layout)