Text responsive to selection with TapTool

Hi there,

I’m fairly new to coding and Bokeh but love it so far. I’m working with a group to produce visualizations for geodata. Anyway I have been off to a pretty good start but I’ve run into an issue with the TapTool. I followed the structure of the code that Sarah Bird uses in her PyCon talk and there is one section where she creates responsive text. This is something I need to do. I structured the code the same way and it didn’t work. I tried running her notebooks (Building the static visualization) from that talk and it didn’t work in there either.

Basically I define a function to create the text and pass the text a variable that based which glyph is selected. I will include a snippet of the code.

def pop_info_text(source, val1):

xdr = Range1d(0, 251)

ydr = Range1d(0, 151)

pop_info_plot = Plot(

x_range=xdr,

y_range=ydr,

title="",

plot_width=250,

plot_height=150,

outline_line_color=None,

toolbar_location=None,

min_border=0,
name = Text(x=0, y=120, text=val1, **FONT_PROPS_LG)
pop_info_plot.add_glyph(source, Text(), selection_glyph=name)
return pop_info_plot

``

This is simplified but I think it shares the point. Basically I want to plot a text object that says the name of the selected glyph, I then call the method.

pop_info_plot = pop_info_text(source, “NAME”)

``

“NAME” corresponds to the column of the data set with the name of the glyph in it.

For some reason nothing happens and I’m really curious about this because it used to work on Sarah Bird’s example but It doesn’t anymore.

I appreciate any help,

-Mark

Hi,

You’ve shared the snippet of the code where the text is added, but you haven’t shared the section of the code where the TapTool is added, and where the glyphs you’re clicking on are added.

Can you share these too? Then can help debug.

If everything has the same source this should work.

Sincerely,

Sarah Bird

···

On Thu, Jun 18, 2015 at 2:42 PM, [email protected] wrote:

Hi there,

I’m fairly new to coding and Bokeh but love it so far. I’m working with a group to produce visualizations for geodata. Anyway I have been off to a pretty good start but I’ve run into an issue with the TapTool. I followed the structure of the code that Sarah Bird uses in her PyCon talk and there is one section where she creates responsive text. This is something I need to do. I structured the code the same way and it didn’t work. I tried running her notebooks (Building the static visualization) from that talk and it didn’t work in there either.

Basically I define a function to create the text and pass the text a variable that based which glyph is selected. I will include a snippet of the code.

def pop_info_text(source, val1):

xdr = Range1d(0, 251)

ydr = Range1d(0, 151)

pop_info_plot = Plot(

x_range=xdr,

y_range=ydr,

title=“”,

plot_width=250,

plot_height=150,

outline_line_color=None,

toolbar_location=None,

min_border=0,
name = Text(x=0, y=120, text=val1, **FONT_PROPS_LG)
pop_info_plot.add_glyph(source, Text(), selection_glyph=name)
return pop_info_plot

``

This is simplified but I think it shares the point. Basically I want to plot a text object that says the name of the selected glyph, I then call the method.

pop_info_plot = pop_info_text(source, “NAME”)

``

“NAME” corresponds to the column of the data set with the name of the glyph in it.

For some reason nothing happens and I’m really curious about this because it used to work on Sarah Bird’s example but It doesn’t anymore.

I appreciate any help,

-Mark

You received this message because you are subscribed to the Google Groups “Bokeh Discussion - Public” group.

To unsubscribe from this group and stop receiving emails from it, send an email to [email protected].

To post to this group, send email to [email protected].

To view this discussion on the web visit https://groups.google.com/a/continuum.io/d/msgid/bokeh/769eaa9c-c4c5-4521-bffb-4d65731b7faa%40continuum.io.

For more options, visit https://groups.google.com/a/continuum.io/d/optout.
Hi,

Sorry for not including that.

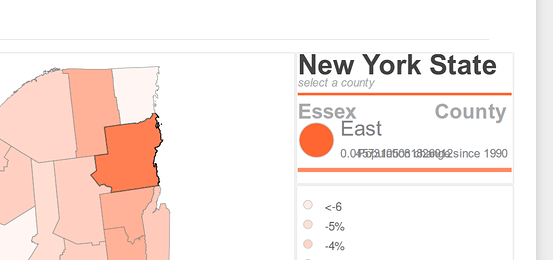
I define a function to create a map (it calls a function to setup the plot which is working correctly). Within this function the TapTool is called. Selecting the glyphs works but the the text update does not.

def make_map(source, fill_color_string = “active_color”):

counties = Patches(

    xs='xs', 

    ys='ys',

    fill_color=fill_color_string,

    line_color=DK_GRAY,

    line_width=0.5,

)   


selected_counties = Patches(

    xs='xs', 

    ys='ys',

    fill_color=fill_color_string,

    line_color=BLACK,

    line_width=1,

)


non_selected_counties = Patches(

    xs='xs', 

    ys='ys',

    fill_color=fill_color_string,

    line_color=DK_GRAY,

    line_width=0.5,

    fill_alpha=0.5,

)

map_box = setup_map_plot()
map_box.add_glyph(source, counties, selection_glyph=selected_counties, nonselection_glyph=non_selected_counties)
map_box.add_tools(TapTool())
return map_box

``

I define the function to create the text

def pop_info_text(source, val1):

xdr = Range1d(0, 251)

ydr = Range1d(0, 151)

pop_info_plot = Plot(

x_range=xdr,

y_range=ydr,

title=“”,

plot_width=250,

plot_height=150,

outline_line_color=None,

toolbar_location=None,

min_border=0,
name = Text(x=0, y=120, text=val1, **FONT_PROPS_LG)
pop_info_plot.add_glyph(source, Text(), selection_glyph=name)
return pop_info_plot

``

I pass the pandas data into a ColumnDataSource

source = ColumnDataSource(data)

I then call the the make_map method and the method that creates the text and everything get assembled into a panel.

pop_plot = make_map(source, “active_color”)

pop_info_plot = pop_info_text(source, “NAME”)

tabs = Tabs(tabs=[

    Panel(title="Zones", child=hplot(zone_plot, vplot(zone_info_plot, zone_legend_plot))),

    Panel(title="Population", child=hplot(pop_plot, vplot(pop_info_plot, pop_legend_plot))),

          ])

``

Thank you for the help. I can try and upload the notebook and data source if that would help as well.

-Mark

···

On Thursday, June 18, 2015 at 2:13:03 PM UTC-4, Sarah Bird wrote:

Hi,

You’ve shared the snippet of the code where the text is added, but you haven’t shared the section of the code where the TapTool is added, and where the glyphs you’re clicking on are added.

Can you share these too? Then can help debug.

If everything has the same source this should work.

Sincerely,

Sarah Bird

On Thu, Jun 18, 2015 at 2:42 PM, [email protected] wrote:

Hi there,

I’m fairly new to coding and Bokeh but love it so far. I’m working with a group to produce visualizations for geodata. Anyway I have been off to a pretty good start but I’ve run into an issue with the TapTool. I followed the structure of the code that Sarah Bird uses in her PyCon talk and there is one section where she creates responsive text. This is something I need to do. I structured the code the same way and it didn’t work. I tried running her notebooks (Building the static visualization) from that talk and it didn’t work in there either.

Basically I define a function to create the text and pass the text a variable that based which glyph is selected. I will include a snippet of the code.

def pop_info_text(source, val1):

xdr = Range1d(0, 251)

ydr = Range1d(0, 151)

pop_info_plot = Plot(

x_range=xdr,

y_range=ydr,

title=“”,

plot_width=250,

plot_height=150,

outline_line_color=None,

toolbar_location=None,

min_border=0,
name = Text(x=0, y=120, text=val1, **FONT_PROPS_LG)
pop_info_plot.add_glyph(source, Text(), selection_glyph=name)
return pop_info_plot

``

This is simplified but I think it shares the point. Basically I want to plot a text object that says the name of the selected glyph, I then call the method.

pop_info_plot = pop_info_text(source, “NAME”)

``

“NAME” corresponds to the column of the data set with the name of the glyph in it.

For some reason nothing happens and I’m really curious about this because it used to work on Sarah Bird’s example but It doesn’t anymore.

I appreciate any help,

-Mark

You received this message because you are subscribed to the Google Groups “Bokeh Discussion - Public” group.

To unsubscribe from this group and stop receiving emails from it, send an email to [email protected].

To post to this group, send email to [email protected].

To view this discussion on the web visit https://groups.google.com/a/continuum.io/d/msgid/bokeh/769eaa9c-c4c5-4521-bffb-4d65731b7faa%40continuum.io.

For more options, visit https://groups.google.com/a/continuum.io/d/optout.
well…i can’t see anything quickly…can you share a sample of the data

···

On Thu, Jun 18, 2015 at 8:03 PM, Mark Warfel [email protected] wrote:

Hi,

Sorry for not including that.

I define a function to create a map (it calls a function to setup the plot which is working correctly). Within this function the TapTool is called. Selecting the glyphs works but the the text update does not.

def make_map(source, fill_color_string = “active_color”):

counties = Patches(
    xs='xs', 
    ys='ys',
    fill_color=fill_color_string,
    line_color=DK_GRAY,
    line_width=0.5,
)   
selected_counties = Patches(
    xs='xs', 
    ys='ys',
    fill_color=fill_color_string,
    line_color=BLACK,
    line_width=1,
)
non_selected_counties = Patches(
    xs='xs', 
    ys='ys',
    fill_color=fill_color_string,
    line_color=DK_GRAY,
    line_width=0.5,
    fill_alpha=0.5,
)

map_box = setup_map_plot()
map_box.add_glyph(source, counties, selection_glyph=selected_counties, nonselection_glyph=non_selected_counties)
map_box.add_tools(TapTool())
return map_box

``

I define the function to create the text

def pop_info_text(source, val1):

xdr = Range1d(0, 251)

ydr = Range1d(0, 151)

pop_info_plot = Plot(

x_range=xdr,

y_range=ydr,

title=“”,

plot_width=250,

plot_height=150,

outline_line_color=None,

toolbar_location=None,

min_border=0,
name = Text(x=0, y=120, text=val1, **FONT_PROPS_LG)
pop_info_plot.add_glyph(source, Text(), selection_glyph=name)
return pop_info_plot

``

I pass the pandas data into a ColumnDataSource

source = ColumnDataSource(data)

I then call the the make_map method and the method that creates the text and everything get assembled into a panel.

pop_plot = make_map(source, “active_color”)

pop_info_plot = pop_info_text(source, “NAME”)

tabs = Tabs(tabs=[

    Panel(title="Zones", child=hplot(zone_plot, vplot(zone_info_plot, zone_legend_plot))),
    Panel(title="Population", child=hplot(pop_plot, vplot(pop_info_plot, pop_legend_plot))),
          ])

``

Thank you for the help. I can try and upload the notebook and data source if that would help as well.

-Mark

On Thursday, June 18, 2015 at 2:13:03 PM UTC-4, Sarah Bird wrote:

Hi,

You’ve shared the snippet of the code where the text is added, but you haven’t shared the section of the code where the TapTool is added, and where the glyphs you’re clicking on are added.

Can you share these too? Then can help debug.

If everything has the same source this should work.

Sincerely,

Sarah Bird

On Thu, Jun 18, 2015 at 2:42 PM, [email protected] wrote:

Hi there,

I’m fairly new to coding and Bokeh but love it so far. I’m working with a group to produce visualizations for geodata. Anyway I have been off to a pretty good start but I’ve run into an issue with the TapTool. I followed the structure of the code that Sarah Bird uses in her PyCon talk and there is one section where she creates responsive text. This is something I need to do. I structured the code the same way and it didn’t work. I tried running her notebooks (Building the static visualization) from that talk and it didn’t work in there either.

Basically I define a function to create the text and pass the text a variable that based which glyph is selected. I will include a snippet of the code.

def pop_info_text(source, val1):

xdr = Range1d(0, 251)

ydr = Range1d(0, 151)

pop_info_plot = Plot(

x_range=xdr,

y_range=ydr,

title=“”,

plot_width=250,

plot_height=150,

outline_line_color=None,

toolbar_location=None,

min_border=0,
name = Text(x=0, y=120, text=val1, **FONT_PROPS_LG)
pop_info_plot.add_glyph(source, Text(), selection_glyph=name)
return pop_info_plot

``

This is simplified but I think it shares the point. Basically I want to plot a text object that says the name of the selected glyph, I then call the method.

pop_info_plot = pop_info_text(source, “NAME”)

``

“NAME” corresponds to the column of the data set with the name of the glyph in it.

For some reason nothing happens and I’m really curious about this because it used to work on Sarah Bird’s example but It doesn’t anymore.

I appreciate any help,

-Mark

You received this message because you are subscribed to the Google Groups “Bokeh Discussion - Public” group.

To unsubscribe from this group and stop receiving emails from it, send an email to [email protected].

To post to this group, send email to [email protected].

To view this discussion on the web visit https://groups.google.com/a/continuum.io/d/msgid/bokeh/769eaa9c-c4c5-4521-bffb-4d65731b7faa%40continuum.io.

For more options, visit https://groups.google.com/a/continuum.io/d/optout.

You received this message because you are subscribed to the Google Groups “Bokeh Discussion - Public” group.

To unsubscribe from this group and stop receiving emails from it, send an email to [email protected].

To post to this group, send email to [email protected].

To view this discussion on the web visit https://groups.google.com/a/continuum.io/d/msgid/bokeh/6b1c8886-3c02-4437-b371-a298a2ef538b%40continuum.io.

For more options, visit https://groups.google.com/a/continuum.io/d/optout.

It’s weird because I ran your notebook as mentioned above and it didn’t work in there either. I know that it can be many things but I’m still confused. Anyway here is a link to my google drive folder containing both the data and notebook for the project(its not that big, roughly 8.5mb):
https://drive.google.com/folderview?id=0B4pOZjbKzkZ6fk5SXzFsMFNnYVRiLUNBbGpYaEdHU2ZWd2FfTGF4ZVZFLUp0dWNIbDZ1ZVU&usp=sharing

Thank you again for the help, I just can’t figure this one out.

–Mark

···

On Thursday, June 18, 2015 at 4:05:03 PM UTC-4, Sarah Bird wrote:

well…i can’t see anything quickly…can you share a sample of the data

On Thu, Jun 18, 2015 at 8:03 PM, Mark Warfel [email protected] wrote:

Hi,

Sorry for not including that.

I define a function to create a map (it calls a function to setup the plot which is working correctly). Within this function the TapTool is called. Selecting the glyphs works but the the text update does not.

def make_map(source, fill_color_string = “active_color”):

counties = Patches(
    xs='xs', 
    ys='ys',
    fill_color=fill_color_string,
    line_color=DK_GRAY,
    line_width=0.5,
)   
selected_counties = Patches(
    xs='xs', 
    ys='ys',
    fill_color=fill_color_string,
    line_color=BLACK,
    line_width=1,
)
non_selected_counties = Patches(
    xs='xs', 
    ys='ys',
    fill_color=fill_color_string,
    line_color=DK_GRAY,
    line_width=0.5,
    fill_alpha=0.5,
)

map_box = setup_map_plot()
map_box.add_glyph(source, counties, selection_glyph=selected_counties, nonselection_glyph=non_selected_counties)
map_box.add_tools(TapTool())
return map_box

``

I define the function to create the text

def pop_info_text(source, val1):

xdr = Range1d(0, 251)

ydr = Range1d(0, 151)

pop_info_plot = Plot(

x_range=xdr,

y_range=ydr,

title=“”,

plot_width=250,

plot_height=150,

outline_line_color=None,

toolbar_location=None,

min_border=0,
name = Text(x=0, y=120, text=val1, **FONT_PROPS_LG)
pop_info_plot.add_glyph(source, Text(), selection_glyph=name)
return pop_info_plot

``

I pass the pandas data into a ColumnDataSource

source = ColumnDataSource(data)

I then call the the make_map method and the method that creates the text and everything get assembled into a panel.

pop_plot = make_map(source, “active_color”)

pop_info_plot = pop_info_text(source, “NAME”)

tabs = Tabs(tabs=[

    Panel(title="Zones", child=hplot(zone_plot, vplot(zone_info_plot, zone_legend_plot))),
    Panel(title="Population", child=hplot(pop_plot, vplot(pop_info_plot, pop_legend_plot))),
          ])

``

Thank you for the help. I can try and upload the notebook and data source if that would help as well.

-Mark

On Thursday, June 18, 2015 at 2:13:03 PM UTC-4, Sarah Bird wrote:

Hi,

You’ve shared the snippet of the code where the text is added, but you haven’t shared the section of the code where the TapTool is added, and where the glyphs you’re clicking on are added.

Can you share these too? Then can help debug.

If everything has the same source this should work.

Sincerely,

Sarah Bird

On Thu, Jun 18, 2015 at 2:42 PM, [email protected] wrote:

Hi there,

I’m fairly new to coding and Bokeh but love it so far. I’m working with a group to produce visualizations for geodata. Anyway I have been off to a pretty good start but I’ve run into an issue with the TapTool. I followed the structure of the code that Sarah Bird uses in her PyCon talk and there is one section where she creates responsive text. This is something I need to do. I structured the code the same way and it didn’t work. I tried running her notebooks (Building the static visualization) from that talk and it didn’t work in there either.

Basically I define a function to create the text and pass the text a variable that based which glyph is selected. I will include a snippet of the code.

def pop_info_text(source, val1):

xdr = Range1d(0, 251)

ydr = Range1d(0, 151)

pop_info_plot = Plot(

x_range=xdr,

y_range=ydr,

title=“”,

plot_width=250,

plot_height=150,

outline_line_color=None,

toolbar_location=None,

min_border=0,
name = Text(x=0, y=120, text=val1, **FONT_PROPS_LG)
pop_info_plot.add_glyph(source, Text(), selection_glyph=name)
return pop_info_plot

``

This is simplified but I think it shares the point. Basically I want to plot a text object that says the name of the selected glyph, I then call the method.

pop_info_plot = pop_info_text(source, “NAME”)

``

“NAME” corresponds to the column of the data set with the name of the glyph in it.

For some reason nothing happens and I’m really curious about this because it used to work on Sarah Bird’s example but It doesn’t anymore.

I appreciate any help,

-Mark

You received this message because you are subscribed to the Google Groups “Bokeh Discussion - Public” group.

To unsubscribe from this group and stop receiving emails from it, send an email to [email protected].

To post to this group, send email to [email protected].

To view this discussion on the web visit https://groups.google.com/a/continuum.io/d/msgid/bokeh/769eaa9c-c4c5-4521-bffb-4d65731b7faa%40continuum.io.

For more options, visit https://groups.google.com/a/continuum.io/d/optout.

You received this message because you are subscribed to the Google Groups “Bokeh Discussion - Public” group.

To unsubscribe from this group and stop receiving emails from it, send an email to [email protected].

To post to this group, send email to [email protected].

To view this discussion on the web visit https://groups.google.com/a/continuum.io/d/msgid/bokeh/6b1c8886-3c02-4437-b371-a298a2ef538b%40continuum.io.

For more options, visit https://groups.google.com/a/continuum.io/d/optout.

Good news & Bad news.

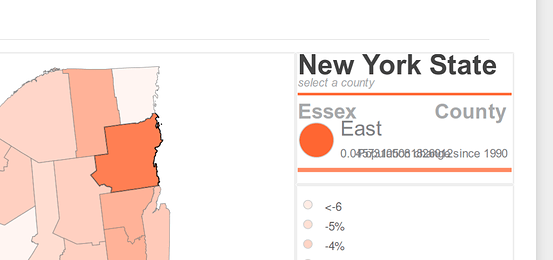
Good news: it works in bokeh 0.8.2 (see screenshot)

Bad news: it doesn’t work in bokeh 0.9 and I don’t know why quickly. Selection changed heavily from 0.8 to 0.9 (which is why my
repo comes with a caveat about 0.9), but I would have expected this to work and I don’t immediately know why its broken.

Seems like a bug, I will try and dig into it next week.

Thank you for your patience.

···

On Thu, Jun 18, 2015 at 9:16 PM, Mark Warfel [email protected] wrote:

It’s weird because I ran your notebook as mentioned above and it didn’t work in there either. I know that it can be many things but I’m still confused. Anyway here is a link to my google drive folder containing both the data and notebook for the project(its not that big, roughly 8.5mb):
https://drive.google.com/folderview?id=0B4pOZjbKzkZ6fk5SXzFsMFNnYVRiLUNBbGpYaEdHU2ZWd2FfTGF4ZVZFLUp0dWNIbDZ1ZVU&usp=sharing

Thank you again for the help, I just can’t figure this one out.

–Mark

On Thursday, June 18, 2015 at 4:05:03 PM UTC-4, Sarah Bird wrote:

well…i can’t see anything quickly…can you share a sample of the data

On Thu, Jun 18, 2015 at 8:03 PM, Mark Warfel [email protected] wrote:

Hi,

Sorry for not including that.

I define a function to create a map (it calls a function to setup the plot which is working correctly). Within this function the TapTool is called. Selecting the glyphs works but the the text update does not.

def make_map(source, fill_color_string = “active_color”):

counties = Patches(
    xs='xs', 
    ys='ys',
    fill_color=fill_color_string,
    line_color=DK_GRAY,
    line_width=0.5,
)   
selected_counties = Patches(
    xs='xs', 
    ys='ys',
    fill_color=fill_color_string,
    line_color=BLACK,
    line_width=1,
)
non_selected_counties = Patches(
    xs='xs', 
    ys='ys',
    fill_color=fill_color_string,
    line_color=DK_GRAY,
    line_width=0.5,
    fill_alpha=0.5,
)

map_box = setup_map_plot()
map_box.add_glyph(source, counties, selection_glyph=selected_counties, nonselection_glyph=non_selected_counties)
map_box.add_tools(TapTool())
return map_box

``

I define the function to create the text

def pop_info_text(source, val1):

xdr = Range1d(0, 251)

ydr = Range1d(0, 151)

pop_info_plot = Plot(

x_range=xdr,

y_range=ydr,

title=“”,

plot_width=250,

plot_height=150,

outline_line_color=None,

toolbar_location=None,

min_border=0,
name = Text(x=0, y=120, text=val1, **FONT_PROPS_LG)
pop_info_plot.add_glyph(source, Text(), selection_glyph=name)
return pop_info_plot

``

I pass the pandas data into a ColumnDataSource

source = ColumnDataSource(data)

I then call the the make_map method and the method that creates the text and everything get assembled into a panel.

pop_plot = make_map(source, “active_color”)

pop_info_plot = pop_info_text(source, “NAME”)

tabs = Tabs(tabs=[

    Panel(title="Zones", child=hplot(zone_plot, vplot(zone_info_plot, zone_legend_plot))),
    Panel(title="Population", child=hplot(pop_plot, vplot(pop_info_plot, pop_legend_plot))),
          ])

``

Thank you for the help. I can try and upload the notebook and data source if that would help as well.

-Mark

On Thursday, June 18, 2015 at 2:13:03 PM UTC-4, Sarah Bird wrote:

Hi,

You’ve shared the snippet of the code where the text is added, but you haven’t shared the section of the code where the TapTool is added, and where the glyphs you’re clicking on are added.

Can you share these too? Then can help debug.

If everything has the same source this should work.

Sincerely,

Sarah Bird

On Thu, Jun 18, 2015 at 2:42 PM, [email protected] wrote:

Hi there,

I’m fairly new to coding and Bokeh but love it so far. I’m working with a group to produce visualizations for geodata. Anyway I have been off to a pretty good start but I’ve run into an issue with the TapTool. I followed the structure of the code that Sarah Bird uses in her PyCon talk and there is one section where she creates responsive text. This is something I need to do. I structured the code the same way and it didn’t work. I tried running her notebooks (Building the static visualization) from that talk and it didn’t work in there either.

Basically I define a function to create the text and pass the text a variable that based which glyph is selected. I will include a snippet of the code.

def pop_info_text(source, val1):

xdr = Range1d(0, 251)

ydr = Range1d(0, 151)

pop_info_plot = Plot(

x_range=xdr,

y_range=ydr,

title=“”,

plot_width=250,

plot_height=150,

outline_line_color=None,

toolbar_location=None,

min_border=0,
name = Text(x=0, y=120, text=val1, **FONT_PROPS_LG)
pop_info_plot.add_glyph(source, Text(), selection_glyph=name)
return pop_info_plot

``

This is simplified but I think it shares the point. Basically I want to plot a text object that says the name of the selected glyph, I then call the method.

pop_info_plot = pop_info_text(source, “NAME”)

``

“NAME” corresponds to the column of the data set with the name of the glyph in it.

For some reason nothing happens and I’m really curious about this because it used to work on Sarah Bird’s example but It doesn’t anymore.

I appreciate any help,

-Mark

You received this message because you are subscribed to the Google Groups “Bokeh Discussion - Public” group.

To unsubscribe from this group and stop receiving emails from it, send an email to [email protected].

To post to this group, send email to [email protected].

To view this discussion on the web visit https://groups.google.com/a/continuum.io/d/msgid/bokeh/769eaa9c-c4c5-4521-bffb-4d65731b7faa%40continuum.io.

For more options, visit https://groups.google.com/a/continuum.io/d/optout.

You received this message because you are subscribed to the Google Groups “Bokeh Discussion - Public” group.

To unsubscribe from this group and stop receiving emails from it, send an email to [email protected].

To post to this group, send email to [email protected].

To view this discussion on the web visit https://groups.google.com/a/continuum.io/d/msgid/bokeh/6b1c8886-3c02-4437-b371-a298a2ef538b%40continuum.io.

For more options, visit https://groups.google.com/a/continuum.io/d/optout.

You received this message because you are subscribed to the Google Groups “Bokeh Discussion - Public” group.

To unsubscribe from this group and stop receiving emails from it, send an email to [email protected].

To post to this group, send email to [email protected].

To view this discussion on the web visit https://groups.google.com/a/continuum.io/d/msgid/bokeh/165caf20-6f4c-4e7d-a7e6-a2d0722e14db%40continuum.io.

For more options, visit https://groups.google.com/a/continuum.io/d/optout.

Would you look at that! I had a feeling it had something to do with upgrading to 0.9.

Thank you again, I appreciate it (and sorry for the code, I bet it’s not the cleanest you’ve ever seen).

This is functionality I need but I can’t really move back to 0.8 to be able to do it (I need the static slider). Thank you for looking into it more!

–Mark

···

On Thursday, June 18, 2015 at 4:52:24 PM UTC-4, Sarah Bird wrote:

Good news & Bad news.

Good news: it works in bokeh 0.8.2 (see screenshot)

Bad news: it doesn’t work in bokeh 0.9 and I don’t know why quickly. Selection changed heavily from 0.8 to 0.9 (which is why my
repo comes with a caveat about 0.9), but I would have expected this to work and I don’t immediately know why its broken.

Seems like a bug, I will try and dig into it next week.

Thank you for your patience.

On Thu, Jun 18, 2015 at 9:16 PM, Mark Warfel [email protected] wrote:

It’s weird because I ran your notebook as mentioned above and it didn’t work in there either. I know that it can be many things but I’m still confused. Anyway here is a link to my google drive folder containing both the data and notebook for the project(its not that big, roughly 8.5mb):
https://drive.google.com/folderview?id=0B4pOZjbKzkZ6fk5SXzFsMFNnYVRiLUNBbGpYaEdHU2ZWd2FfTGF4ZVZFLUp0dWNIbDZ1ZVU&usp=sharing

Thank you again for the help, I just can’t figure this one out.

–Mark

On Thursday, June 18, 2015 at 4:05:03 PM UTC-4, Sarah Bird wrote:

well…i can’t see anything quickly…can you share a sample of the data

On Thu, Jun 18, 2015 at 8:03 PM, Mark Warfel [email protected] wrote:

Hi,

Sorry for not including that.

I define a function to create a map (it calls a function to setup the plot which is working correctly). Within this function the TapTool is called. Selecting the glyphs works but the the text update does not.

def make_map(source, fill_color_string = “active_color”):

counties = Patches(
    xs='xs', 
    ys='ys',
    fill_color=fill_color_string,
    line_color=DK_GRAY,
    line_width=0.5,
)   
selected_counties = Patches(
    xs='xs', 
    ys='ys',
    fill_color=fill_color_string,
    line_color=BLACK,
    line_width=1,
)
non_selected_counties = Patches(
    xs='xs', 
    ys='ys',
    fill_color=fill_color_string,
    line_color=DK_GRAY,
    line_width=0.5,
    fill_alpha=0.5,
)

map_box = setup_map_plot()
map_box.add_glyph(source, counties, selection_glyph=selected_counties, nonselection_glyph=non_selected_counties)
map_box.add_tools(TapTool())
return map_box

``

I define the function to create the text

def pop_info_text(source, val1):

xdr = Range1d(0, 251)

ydr = Range1d(0, 151)

pop_info_plot = Plot(

x_range=xdr,

y_range=ydr,

title=“”,

plot_width=250,

plot_height=150,

outline_line_color=None,

toolbar_location=None,

min_border=0,
name = Text(x=0, y=120, text=val1, **FONT_PROPS_LG)
pop_info_plot.add_glyph(source, Text(), selection_glyph=name)
return pop_info_plot

``

I pass the pandas data into a ColumnDataSource

source = ColumnDataSource(data)

I then call the the make_map method and the method that creates the text and everything get assembled into a panel.

pop_plot = make_map(source, “active_color”)

pop_info_plot = pop_info_text(source, “NAME”)

tabs = Tabs(tabs=[

    Panel(title="Zones", child=hplot(zone_plot, vplot(zone_info_plot, zone_legend_plot))),
    Panel(title="Population", child=hplot(pop_plot, vplot(pop_info_plot, pop_legend_plot))),
          ])

``

Thank you for the help. I can try and upload the notebook and data source if that would help as well.

-Mark

On Thursday, June 18, 2015 at 2:13:03 PM UTC-4, Sarah Bird wrote:

Hi,

You’ve shared the snippet of the code where the text is added, but you haven’t shared the section of the code where the TapTool is added, and where the glyphs you’re clicking on are added.

Can you share these too? Then can help debug.

If everything has the same source this should work.

Sincerely,

Sarah Bird

On Thu, Jun 18, 2015 at 2:42 PM, [email protected] wrote:

Hi there,

I’m fairly new to coding and Bokeh but love it so far. I’m working with a group to produce visualizations for geodata. Anyway I have been off to a pretty good start but I’ve run into an issue with the TapTool. I followed the structure of the code that Sarah Bird uses in her PyCon talk and there is one section where she creates responsive text. This is something I need to do. I structured the code the same way and it didn’t work. I tried running her notebooks (Building the static visualization) from that talk and it didn’t work in there either.

Basically I define a function to create the text and pass the text a variable that based which glyph is selected. I will include a snippet of the code.

def pop_info_text(source, val1):

xdr = Range1d(0, 251)

ydr = Range1d(0, 151)

pop_info_plot = Plot(

x_range=xdr,

y_range=ydr,

title=“”,

plot_width=250,

plot_height=150,

outline_line_color=None,

toolbar_location=None,

min_border=0,
name = Text(x=0, y=120, text=val1, **FONT_PROPS_LG)
pop_info_plot.add_glyph(source, Text(), selection_glyph=name)
return pop_info_plot

``

This is simplified but I think it shares the point. Basically I want to plot a text object that says the name of the selected glyph, I then call the method.

pop_info_plot = pop_info_text(source, “NAME”)

``

“NAME” corresponds to the column of the data set with the name of the glyph in it.

For some reason nothing happens and I’m really curious about this because it used to work on Sarah Bird’s example but It doesn’t anymore.

I appreciate any help,

-Mark

You received this message because you are subscribed to the Google Groups “Bokeh Discussion - Public” group.

To unsubscribe from this group and stop receiving emails from it, send an email to [email protected].

To post to this group, send email to [email protected].

To view this discussion on the web visit https://groups.google.com/a/continuum.io/d/msgid/bokeh/769eaa9c-c4c5-4521-bffb-4d65731b7faa%40continuum.io.

For more options, visit https://groups.google.com/a/continuum.io/d/optout.

You received this message because you are subscribed to the Google Groups “Bokeh Discussion - Public” group.

To unsubscribe from this group and stop receiving emails from it, send an email to [email protected].

To post to this group, send email to [email protected].

To view this discussion on the web visit https://groups.google.com/a/continuum.io/d/msgid/bokeh/6b1c8886-3c02-4437-b371-a298a2ef538b%40continuum.io.

For more options, visit https://groups.google.com/a/continuum.io/d/optout.

You received this message because you are subscribed to the Google Groups “Bokeh Discussion - Public” group.

To unsubscribe from this group and stop receiving emails from it, send an email to [email protected].

To post to this group, send email to [email protected].

To view this discussion on the web visit https://groups.google.com/a/continuum.io/d/msgid/bokeh/165caf20-6f4c-4e7d-a7e6-a2d0722e14db%40continuum.io.

For more options, visit https://groups.google.com/a/continuum.io/d/optout.

Hi Mark,
has anyone found a solution for your question jet? i ran into the same problem and can not find a solution.

···

Am Donnerstag, 18. Juni 2015 16:18:35 UTC+2 schrieb [email protected]:

Hi there,

I’m fairly new to coding and Bokeh but love it so far. I’m working with a group to produce visualizations for geodata. Anyway I have been off to a pretty good start but I’ve run into an issue with the TapTool. I followed the structure of the code that Sarah Bird uses in her PyCon talk and there is one section where she creates responsive text. This is something I need to do. I structured the code the same way and it didn’t work. I tried running her notebooks (Building the static visualization) from that talk and it didn’t work in there either.

Basically I define a function to create the text and pass the text a variable that based which glyph is selected. I will include a snippet of the code.

def pop_info_text(source, val1):

xdr = Range1d(0, 251)

ydr = Range1d(0, 151)

pop_info_plot = Plot(

x_range=xdr,

y_range=ydr,

title=“”,

plot_width=250,

plot_height=150,

outline_line_color=None,

toolbar_location=None,

min_border=0,
name = Text(x=0, y=120, text=val1, **FONT_PROPS_LG)
pop_info_plot.add_glyph(source, Text(), selection_glyph=name)
return pop_info_plot

``

This is simplified but I think it shares the point. Basically I want to plot a text object that says the name of the selected glyph, I then call the method.

pop_info_plot = pop_info_text(source, “NAME”)

``

“NAME” corresponds to the column of the data set with the name of the glyph in it.

For some reason nothing happens and I’m really curious about this because it used to work on Sarah Bird’s example but It doesn’t anymore.

I appreciate any help,

-Mark

Hi,

The code just needs to be re-written for newer bokeh selections (there
are other examples in the bokeh user guide to see how to interact with
selections and a CustomJS).

So much has happened in bokeh since my pycon talk last year.

It would be much easier to make and deploy the plots in the latest 0.11.

If you're having problems with specific code, feel free to start a new
thread.

Sincerely,

Sarah Bird

···

On 12/16/15 5:03 AM, [email protected] wrote:

Hi Mark,
has anyone found a solution for your question jet? i ran into the same
problem and can not find a solution.

Am Donnerstag, 18. Juni 2015 16:18:35 UTC+2 schrieb markw...@markwarfel.com:

    Hi there,

    I'm fairly new to coding and Bokeh but love it so far. I'm working
    with a group to produce visualizations for geodata. Anyway I have
    been off to a pretty good start but I've run into an issue with the
    TapTool. I followed the structure of the code that Sarah Bird uses
    in her PyCon talk and there is one section where she creates
    responsive text. This is something I need to do. I structured the
    code the same way and it didn't work. I tried running her notebooks
    (Building the static visualization) from that talk and it didn't
    work in there either.

    Basically I define a function to create the text and pass the text a
    variable that based which glyph is selected. I will include a
    snippet of the code.

    >
    def pop_info_text(source, val1):
        xdr = Range1d(0, 251)
        ydr = Range1d(0, 151)
        pop_info_plot = Plot(
            x_range=xdr,
            y_range=ydr,
            title="",
            plot_width=250,
            plot_height=150,
            outline_line_color=None,
            toolbar_location=None,
            min_border=0,
        name = Text(x=0, y=120, text=val1, **FONT_PROPS_LG)
        pop_info_plot.add_glyph(source, Text(), selection_glyph=name)
        return pop_info_plot
    >
    This is simplified but I think it shares the point. Basically I want
    to plot a text object that says the name of the selected glyph, I
    then call the method.
    >
    pop_info_plot = pop_info_text(source, "NAME")
    >
    "NAME" corresponds to the column of the data set with the name of
    the glyph in it.

    For some reason nothing happens and I'm really curious about this
    because it used to work on Sarah Bird's example but It doesn't anymore.

    I appreciate any help,

    -Mark

--
You received this message because you are subscribed to the Google
Groups "Bokeh Discussion - Public" group.
To unsubscribe from this group and stop receiving emails from it, send
an email to [email protected]
<mailto:[email protected]>.
To post to this group, send email to [email protected]
<mailto:[email protected]>.
To view this discussion on the web visit
https://groups.google.com/a/continuum.io/d/msgid/bokeh/885b044d-a19a-40eb-8c7f-f6897ee2bb75%40continuum.io
<https://groups.google.com/a/continuum.io/d/msgid/bokeh/885b044d-a19a-40eb-8c7f-f6897ee2bb75%40continuum.io?utm_medium=email&utm_source=footer&gt;\.
For more options, visit https://groups.google.com/a/continuum.io/d/optout\.