I am finding that it is CPU intensive to update text, inside PreText for example, next to a figure.
I think it could be related to this Bug report:
I have tested this on two computers:
-
Raspberry Pi 3B+
- OS: Raspbian stretch 9.11
- Python: 3.7.3
- Bokeh: 2.0.2
- Browser: Chromium 72.0.3626.121
-
Desktop PC:
- OS: Ubuntu 18.04.4
- Python: 3.6.7
- Bokeh: 2.0.2
- Browser: Chromium 83.0.4103.61 and Firefox 76.0.1
Example code is:
# standard lib
import random
import time

# Bokeh imports
from bokeh.models import ColumnDataSource, PreText, Div, Paragraph, Spacer
from bokeh.layouts import row, column, gridplot
from bokeh.plotting import curdoc, figure

show_figures = True
update_figures = True
show_text = True
update_text = True

# size of starting data
start_npts = 2000

# size of new data to send at update
update_npts = 5

# Update time in ms
figure_update_time = 5000
text_update_time = 500

# Backend to use for figures
figure_backend = 'webgl'   # 'canvas' or 'webgl'

count = 0

doc = curdoc()

# setup figures with some starting data from the past
plots = [{} for i in range(4)]

t = time.time()

for p in plots:
    # time is in ms
    p['data'] = {'value': [random.random()*100 for i in range(start_npts)], 'time': [(t-i*1.0)*1000 for i in range(start_npts)]}
    p['source'] = ColumnDataSource(data=p['data'])
    p['figure'] = figure(plot_width=300, plot_height=100,
                         sizing_mode='stretch_both',
                         x_axis_type='datetime',
                         output_backend=figure_backend)
    p['figure'].square(x='time', y='value', source=p['source'], size=5, color="black")


# arrange figures in a column via gridplot
fig_col = gridplot([p['figure'] for p in plots], ncols=1, toolbar_location='left')


# Setup and arrange text in column
static_text = PreText(text="This text does not change\n", width=200, height=100, sizing_mode='stretch_both')
dynamic_text = PreText(text="This text changes\n", width=200, height=100, sizing_mode='stretch_both')

text_col = column([static_text, dynamic_text])

# Spacer
space = Spacer(width=200, height=200)

# group fig and text in a row
doc_layout = row([fig_col if show_figures else space, text_col if show_text else space], sizing_mode='stretch_height')

# doc_layout = text_col

# add group layout to the document
doc.add_root(doc_layout)


def figure_update_func():
    for p in plots:
        new_data = {
            'value': [random.random()*100 for n in range(update_npts)],
            'time': [time.time()*1000+n*100 for n in range(update_npts)],
        }
        p['source'].stream(new_data)

    print(len(plots[0]['data']['time']))


def text_update_func():
    global count

    count += 1
    print(count)

    dynamic_text_buff = "This text changes\n"
    dynamic_text_buff += "Counter: {}\n".format(count)
    dynamic_text_buff += "Number of points in each figure: {}\n".format(len(plots[0]['data']['time']))
    dynamic_text.text = dynamic_text_buff


if update_figures and show_figures:
    doc.add_periodic_callback(figure_update_func, figure_update_time)

if update_text and show_text:
    doc.add_periodic_callback(text_update_func, text_update_time)
If I display and update just the text (show_figures = False, update_figures = False, show_text = True, update_text = True) the web browser uses very little CPU.
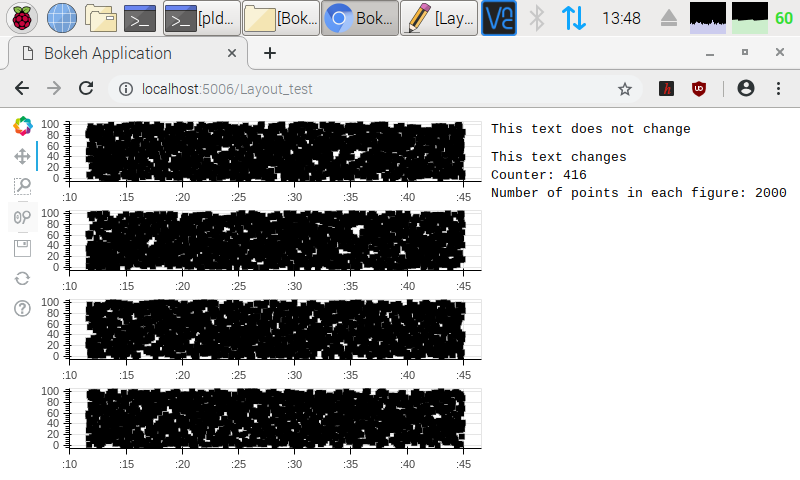
The CPU usage for the Raspberry Pi can be seen in the top right corner (Blue) on the screenshot below.

If i add a static figure next to it (show_figures = True, update_figures = False, show_text = True, update_text = True) then the CPU use increases significantly.
I observed this behaviour on my desktop PC as well but I needed to add more figures in the figure column, 10+ (at 40 it was using up an entire core).
I observed this both in Firefox and Chromium, although the Chromium did use a bit less CPU then Firefox.
In contrast to the above mentioned Bug.
Adding more points to the figures did not have any effect.
Neither did changing the PreText to Div or Paragraph, or using HTML5 canvas instead of WebGL.
For completeness I include a screenshots of just updating the figures (show_figures = True, update_figures = True, show_text = True, update_text = False),
and of updating the figures and text (show_figures = True, update_figures = True, show_text = True, update_text = False)


I also tried explicitly setting all the elements (p['figure'], fig_col, static_text, dynamic_text, text_col, doc_layout) to sizing_mode='fixed' and it did not help.
I looked a bit into the Chromium and Firefox inspector performance and there seems to be a lot of measure, _measure, _measure_cells, _measure_grid calls.
I do not know enough to interpret this correctly.
Any idea what could be causing this and how I could avoid this high CPU use when updating text?
 ).
).