Texts in Charts

Hello all,

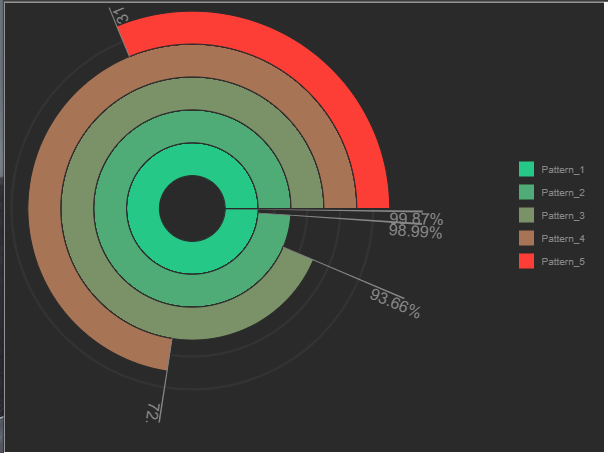
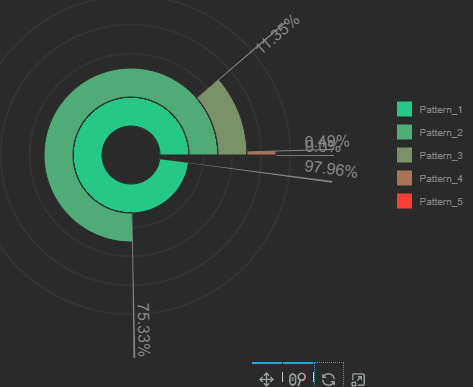
I tried to draw something like this in bokeh:

→ there is no problem to use “annular_wedge”, but problem is to determine correct position (x, y) and angle for text. I found is almost impossible to align it with the line:
image
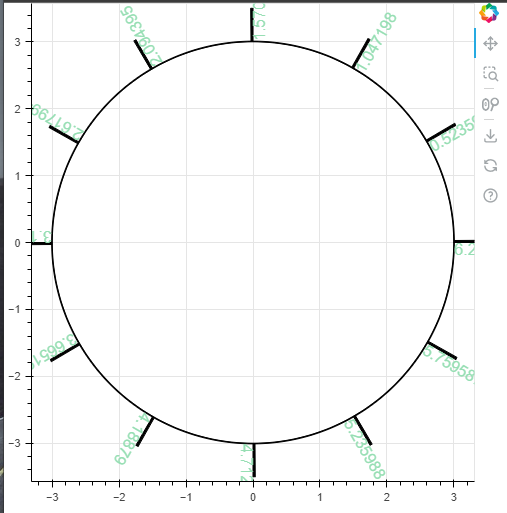
→ this is my result as you can see the text is always in different possition agains cetral point [0,0]

So to make it easier (not need to reproduce all what I have → SQL reads, .json reading …) I prepared one simple example to demonstrate issue:

Result:

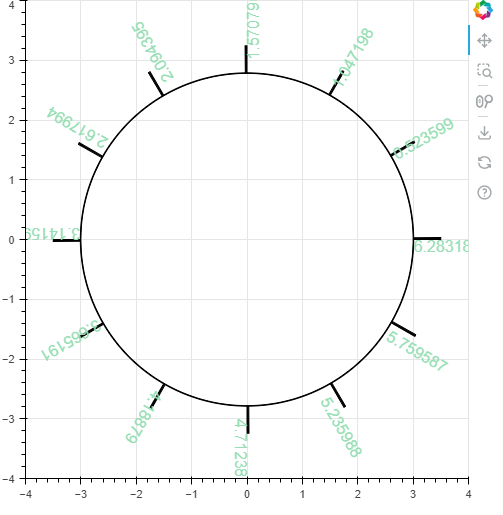
→ Issue is that somehow when I use the text with angle (or without I dont know) the also distance from center differs.
→ the most evidence it is on x-axis where texts are at the circle and correclty attached to line, on other hand on y-axis they are a little bit stretch out from central point
→ also noticed that durind Zooming the text changes coordinates agains the rest of objects.

here is complete code I used:

from bokeh.plotting import figure, show
from math import pi, sin, cos


def x_coordinace(radius, angle):
    x = radius * cos(angle)
    return x

def y_coordinace(radius, angle):
    y = radius * sin(angle)
    return y

def round_percentage(item):
    item = round(float(item),2)
    item = str(f"{item}%")
    return item


plot = figure(
    title=None, width=500, height=500, x_range = [-4, 4], y_range = [-4, 4],
    min_border=0)

# Main circle
plot.annular_wedge(
    x = 0, 
    y = 0, 
    inner_radius = 3, 
    outer_radius = 3.01,
    direction = "anticlock", 
    start_angle = 0,
    start_angle_units = "rad",    # "deg", "rad", "grad" and "turn".
    end_angle = 2 * pi,
    end_angle_units = "rad",      # "deg", "rad", "grad" and "turn".
    line_color = "black", 
    fill_color = "black")


N = 12
Angle_ratio = 2 * pi / N
Angles_rad = []
Pre_angle = 0
for i in range(N):
    New_angle = Pre_angle + Angle_ratio
    Angles_rad.append(round(New_angle, 6))
    Pre_angle = New_angle

Radius_list = [3.01] * N
anchor = ["top_left"] * N
angle_units = ["rad"] * N

# small steps
Pre_angle = 0
for i in range(N):
    New_angle = Pre_angle + Angle_ratio
    plot.annular_wedge(
        x = 0, 
        y = 0, 
        inner_radius = 3.01, 
        outer_radius = 3.5,
        direction = "anticlock", 
        start_angle = New_angle,
        start_angle_units = "rad",    # "deg", "rad", "grad" and "turn".
        end_angle = New_angle + 0.01,
        end_angle_units = "rad",      # "deg", "rad", "grad" and "turn".
        line_color = "black", 
        fill_color = "black")
    Pre_angle = New_angle

text = list(map(str,Angles_rad))
x = list(map(x_coordinace,Radius_list,Angles_rad))
y = list(map(y_coordinace,Radius_list,Angles_rad))
angle = Angles_rad

plot.text(x=x, y=y, text=text, angle=angle, angle_units = "rad", text_color="#96deb3", anchor = anchor)

show(plot)

My Bokeh Version is: 3.1
Python: 3.11.2
Using Windows 10
and displaying result in Microsoft Edge

can you please help?

thank you

Jan

For something like this you will definitely need to set match_aspect=True on the plot and also use auto-ranging rather than setting explicit ranges.

Hello Bryan,

thnak you forl hint, it is working correctly now, to text is correctl pointed to he x, y space. Unfortuantelly this coused that charts are a little bit zoomed in so not showing all data (especially I thing that is not counting with text lenght).

Another thing which I would like to understand is why the text is changing its size during zooming (is this because of units?)

Otherwise I really appreciate your help at all :-).

Here are results how my charts looks like right after generation (zoomedin and center is a little bit left):
image
→ similar thing happened for code example (there is just a little bit zoomed in)

from bokeh.plotting import figure, show
from math import pi, sin, cos


def x_coordinace(radius, angle):
    x = radius * cos(angle)
    return x

def y_coordinace(radius, angle):
    y = radius * sin(angle)
    return y

def round_percentage(item):
    item = round(float(item),2)
    item = str(f"{item}%")
    return item


plot = figure(
    title=None, width=500, height=500,
    min_border=0, match_aspect=True)

# Main circle
plot.annular_wedge(
    x = 0, 
    y = 0, 
    inner_radius = 3, 
    outer_radius = 3.01,
    direction = "anticlock", 
    start_angle = 0,
    start_angle_units = "rad",    # "deg", "rad", "grad" and "turn".
    end_angle = 2 * pi,
    end_angle_units = "rad",      # "deg", "rad", "grad" and "turn".
    line_color = "black", 
    fill_color = "black")


N = 12
Angle_ratio = 2 * pi / N
Angles_rad = []
Pre_angle = 0
for i in range(N):
    New_angle = Pre_angle + Angle_ratio
    Angles_rad.append(round(New_angle, 6))
    Pre_angle = New_angle

Radius_list = [3.01] * N
anchor = ["top_left"] * N
angle_units = ["rad"] * N

# small steps
Pre_angle = 0
for i in range(N):
    New_angle = Pre_angle + Angle_ratio
    plot.annular_wedge(
        x = 0, 
        y = 0, 
        inner_radius = 3.01, 
        outer_radius = 3.5,
        direction = "anticlock", 
        start_angle = New_angle,
        start_angle_units = "rad",    # "deg", "rad", "grad" and "turn".
        end_angle = New_angle + 0.01,
        end_angle_units = "rad",      # "deg", "rad", "grad" and "turn".
        line_color = "black", 
        fill_color = "black")
    Pre_angle = New_angle

text = list(map(str,Angles_rad))
x = list(map(x_coordinace,Radius_list,Angles_rad))
y = list(map(y_coordinace,Radius_list,Angles_rad))
angle = Angles_rad

plot.text(x=x, y=y, text=text, angle=angle, angle_units = "rad", text_color="#96deb3", anchor = anchor)

show(plot)

Thank you

Jan

I think having text participate more fully in auto-ranging is still a work in progress. cc @mateusz For the time being, if you need to “expand” things, a workaround would be to plot some invisible (alpha=0) circles at the corners of a “bounding box” you want to define.

Another thing which I would like to understand is why the text is changing its size during zooming (is this because of units?)

I am actually not sure I understand this one. We actually have several issues about the converse, i.e. the text not changing size with zoom, and that is what I would expect to see. I will have to actually run the code soon to investigate.

Bello

So ai tested first part,

For the time being, if you need to “expand” things, a workaround would be to plot some invisible (alpha=0) circles at the corners of a “bounding box” you want to define.

and circle was not working ( draw circle with higer radius, but zoom was still there). Only wgat helps was to draw 4 text on x and y axes (0°, 90° 180° and 270°), text was simple “.” and byt this it was working. Seems that this zoom efect is influenced by figure.text glym(parameter - anchor)

Solution:

# Helper invisible text to make Chart in center
    N = 4
    Angles_rad = []
    Pre_angle = 0
    Angle_ratio = 2 * pi / N
    text = ["."] * N
    Radius_list = [Outher_Radius + ((Outher_Radius - Innter_Radius) *0.5)] * N
    for i in range(N):
        New_angle = Pre_angle + Angle_ratio
        Angles_rad.append(round(New_angle, 6))
        Pre_angle = New_angle
    x = list(map(x_coordinace,Radius_list,Angles_rad))
    y = list(map(y_coordinace,Radius_list,Angles_rad))
    angle = Angles_rad
    Chart.text(x=x, y=y, text=text, angle=angle, angle_units = "rad", text_color="#96deb3", text_alpha = 0)

Jan

This topic was automatically closed 90 days after the last reply. New replies are no longer allowed.