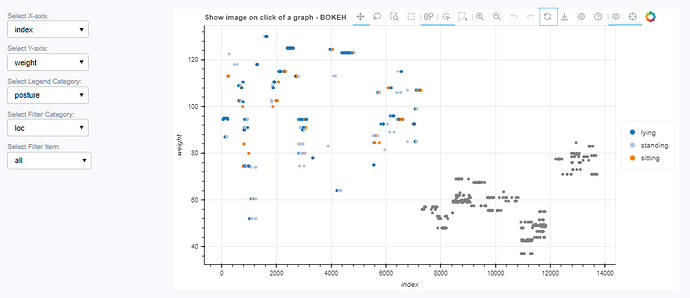
The colors in the legend do not match the plots on the graph (legend_location_outside)

I have placed the legend outside of the graph, but the colors of the plot and the legend do not match.
In the figure below, the plot area is correctly shown in three colors, but the legend is in one color.
(Some of the data is grayed out due to missing data, but this is correct.)
I need you to tell me what I need to do to fix this problem.

The following is the source code extracted from the relevant part of my application.

from bokeh.plotting import ColumnDataSource, figure
from bokeh.models import Legend, LegendItem
from bokeh.plotting import figure
from bokeh.transform import factor_cmap
from bokeh.palettes import Category20

    categories = list(set(df["legend_category"]))
    palette = Category20[20] * 500
    source = ColumnDataSource(data=df)

    p = figure(
        width=900,
        height=500,
        tooltips=TOOLTIPS,
        title="Show image on click of a graph - BOKEH",
        x_axis_label="x",
        y_axis_label="y",
        tools=TOOLS,
        toolbar_location="above",
    )

    color_mapper = factor_cmap(
        "legend_category", palette=palette[: len(categories)], factors=categories
    )
    scatter = p.scatter(x="x", y="y", source=source, color=color_mapper)

    legend_items = [
        LegendItem(label=cat, renderers=[scatter], index=i)
        for i, cat in enumerate(categories)
    ]

    legend = Legend(items=legend_items)

    p.add_layout(legend, "right")

bokeh info

Python version        :  3.10.14 (main, Jun 13 2024, 06:43:06) [GCC 12.2.0]
IPython version       :  (not installed)
Tornado version       :  6.4.1
Bokeh version         :  3.5.1
BokehJS static path   :  /usr/local/lib/python3.10/site-packages/bokeh/server/static
node.js version       :  (not installed)
npm version           :  (not installed)
jupyter_bokeh version :  (not installed)
Operating system      :  Linux-5.15.0-113-generic-x86_64-with-glibc2.36
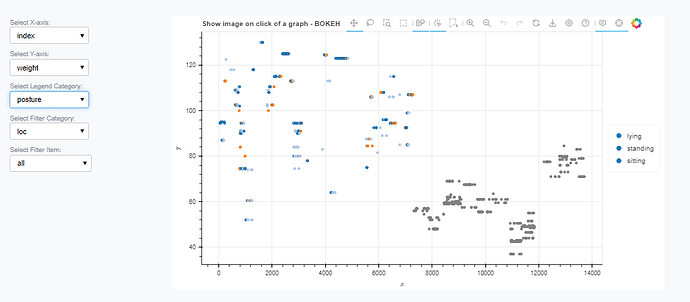
The index is an index into the “rows” of the CDS and the legend displays an item according to what is at the corresponding location in the CDS. Your index values are just a count from zero to N so you will just get whatever the first N items in the CDS happen to look like. You need to pick index values according to the representative items you actually want displayed.

Another option is to use legend_field and let all the grouping and selection happen automatically on the BokehJS side. But you give up some of the control of using legend items manually.

Thank you for your clear answer.
I was able to solve the problem with the following modifications.

from bokeh.plotting import ColumnDataSource, figure
from bokeh.models import Legend, LegendItem
from bokeh.plotting import figure
from bokeh.transform import factor_cmap
from bokeh.palettes import Category20

    categories_df = df['legend_category'].replace('', pd.NA).dropna().drop_duplicates()

    categories = categories_df.tolist()
    unique_indexes = categories_df.index.tolist()

    categories_with_index = [categories, unique_indexes]

    p = figure(
        width=900,
        height=500,
        tooltips=TOOLTIPS,
        title="Show image on click of a graph - BOKEH",
        x_axis_label="x",
        y_axis_label="y",
        tools=TOOLS,
        toolbar_location="above",
    )

    color_mapper = factor_cmap(
        "legend_category", palette=palette[: len(categories)], factors=categories
    )
    scatter = p.scatter(x="x", y="y", source=source, color=color_mapper)

    legend_items = [
        LegendItem(label=cat, renderers=[scatter], index=index)
        for cat,index in zip(categories_with_index[0],categories_with_index[1])
    ]

    legend = Legend(items=legend_items)

    p.add_layout(legend, "right")
1 Like

This topic was automatically closed 90 days after the last reply. New replies are no longer allowed.