Code:
import time
from bokeh.io import curdoc
from bokeh.plotting import figure, show
from bokeh.models import LinearAxis, Span

processes, seconds = [], []
for line in ['1	2:55',
             '2	2:01',
             '3	1:25',
             '4	1:09',
             '5	1:10',
             '6	1:13',
             '7	1:16',
             '8	1:10']:
        row = line.rstrip().split('\t')
        processes.append(int(row[0]))
        seconds.append(time.strptime(row[1],
                                     '%H:%M'))
curdoc().theme = 'dark_minimal'
p = figure(x_axis_label='Parallel processes',
           y_axis_label='Time',
           x_range=(0, processes[-1]))
cores_label_place = processes[-1] // 4
threads_label_place = processes[-1] - cores_label_place
p.add_layout(LinearAxis(ticker=[cores_label_place,
                                threads_label_place],
                        major_label_overrides={cores_label_place: 'CPU cores',
                                               threads_label_place: 'CPU threads'}),
             'above')
p.add_layout(Span(location=processes[-1] / 2,
                  dimension='height',
                  line_dash='dashed',
                  line_color='white'))
p.line(processes, seconds)
show(p)
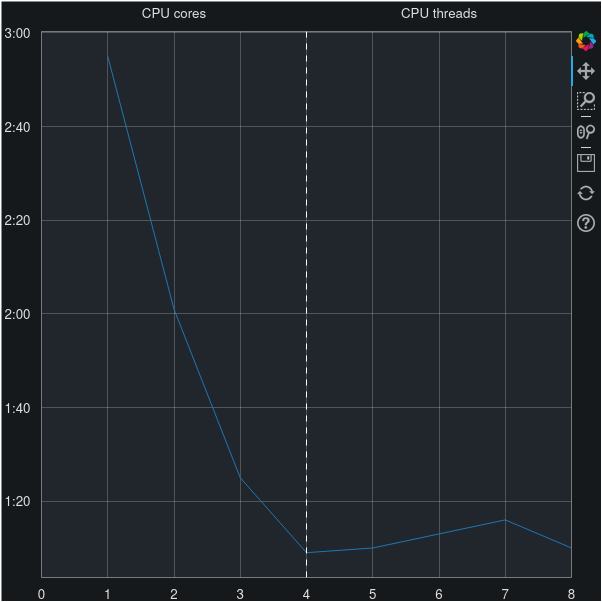
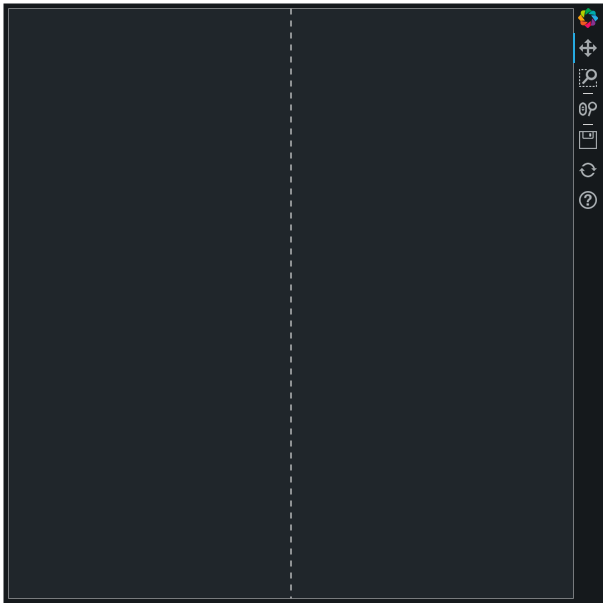
Result:
Neither the main axis labels, nor the additional axis labels, nor the main line are displayed. But the span line is shown.
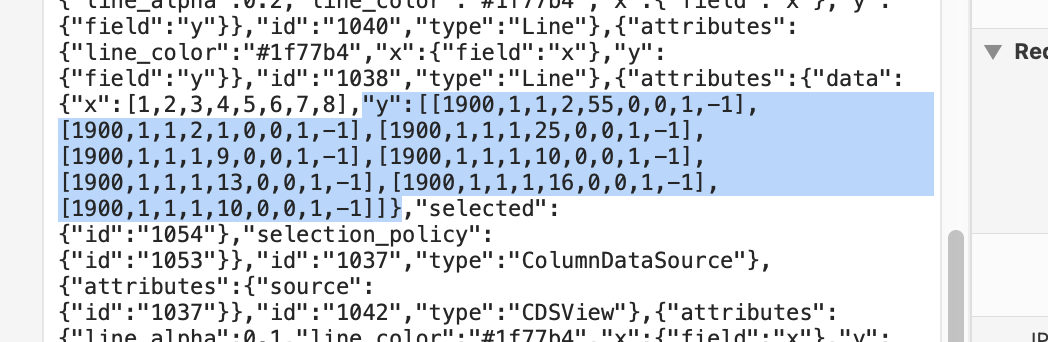
Plotted objects:
[1, 2, 3, 4, 5, 6, 7, 8]
[time.struct_time(tm_year=1900, tm_mon=1, tm_mday=1, tm_hour=2, tm_min=55, tm_sec=0, tm_wday=0, tm_yday=1, tm_isdst=-1), time.struct_time(tm_year=1900, tm_mon=1, tm_mday=1, tm_hour=2, tm_min=1, tm_sec=0, tm_wday=0, tm_yday=1, tm_isdst=-1), time.struct_time(tm_year=1900, tm_mon=1, tm_mday=1, tm_hour=1, tm_min=25, tm_sec=0, tm_wday=0, tm_yday=1, tm_isdst=-1), time.struct_time(tm_year=1900, tm_mon=1, tm_mday=1, tm_hour=1, tm_min=9, tm_sec=0, tm_wday=0, tm_yday=1, tm_isdst=-1), time.struct_time(tm_year=1900, tm_mon=1, tm_mday=1, tm_hour=1, tm_min=10, tm_sec=0, tm_wday=0, tm_yday=1, tm_isdst=-1), time.struct_time(tm_year=1900, tm_mon=1, tm_mday=1, tm_hour=1, tm_min=13, tm_sec=0, tm_wday=0, tm_yday=1, tm_isdst=-1), time.struct_time(tm_year=1900, tm_mon=1, tm_mday=1, tm_hour=1, tm_min=16, tm_sec=0, tm_wday=0, tm_yday=1, tm_isdst=-1), time.struct_time(tm_year=1900, tm_mon=1, tm_mday=1, tm_hour=1, tm_min=10, tm_sec=0, tm_wday=0, tm_yday=1, tm_isdst=-1)]