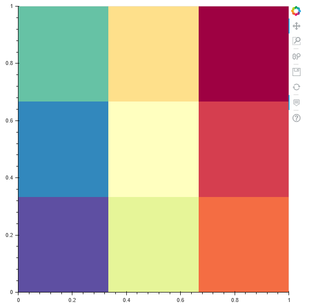
I need to draw a heatmap in realtime, using the method described in unemployment.py — Bokeh 2.4.2 Documentation, I have achieved my goal.
The problem is that my heatmap is quite large - about 20-50 rows and about a thousand columns, and here the method of constructing hetmap with the help of a rect glyph is no longer suitable - everything becomes terribly slow.
There is a way to build a very fast map using image glyph, But! The problem is that the image glyph builds the image in rows, and in my case I need to build in columns - to easily add new data through source.stream.
Those
-
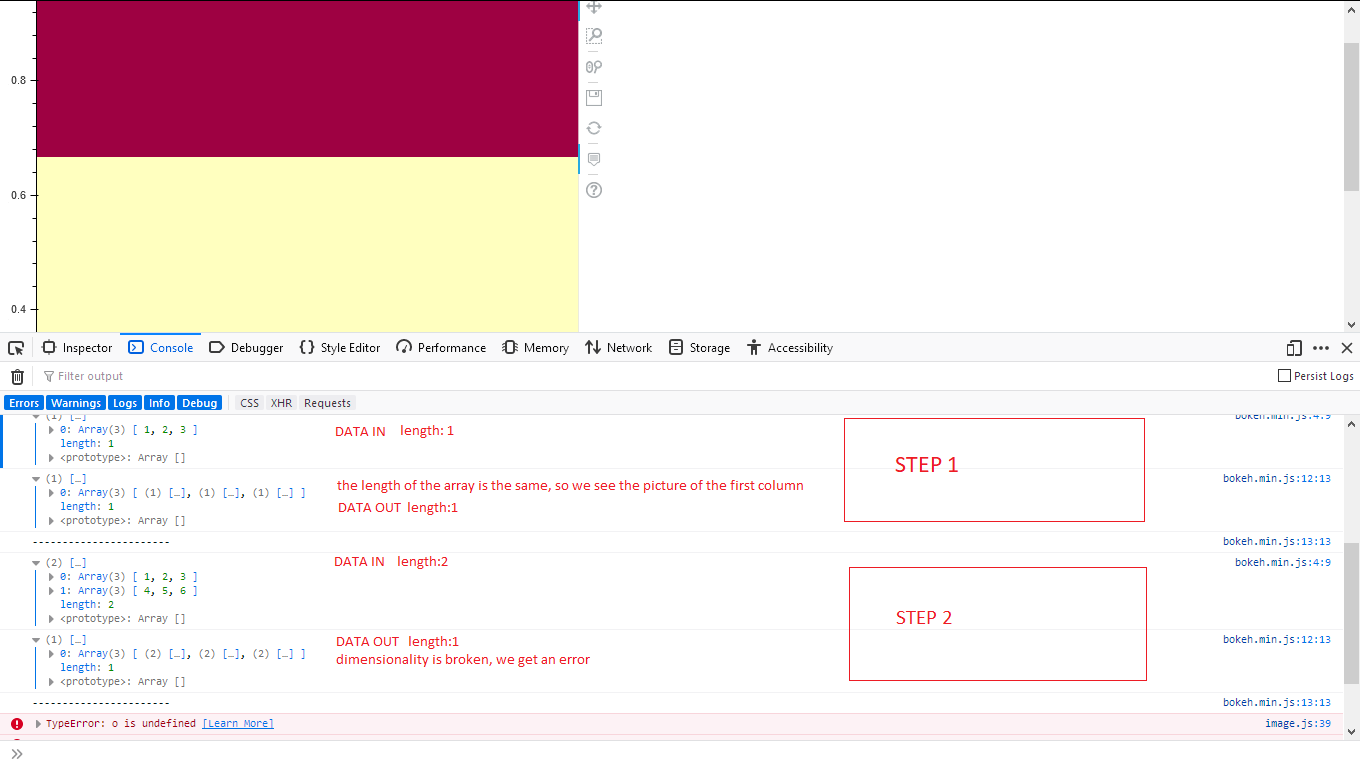
data = [[1], [2], [3]]will show a single-column heatmap -
data = [[1,4], [2,5], [3,6]]- 2 columns -
data = [[1,4,7], [2,5,8], [3,6,9]]- 3 columns
and so on
This method is unsuitable for adding data through source.stream - you have to change the source data entirely.
Is there a way that image glyph with data = [[1,2,3]] would draw 1 column, with data = [[1,2,3], [4,5,6]] 2 columns?
from bokeh.plotting import curdoc, figure, ColumnDataSource, show

data = [[1,2,3]] # I want a column, not a row

img_source = ColumnDataSource(data=dict(vol=[]))

p = figure(tooltips=[("value", "@vol")])
p.x_range.range_padding = p.y_range.range_padding = 0

p.image (image="vol", x=0, y=0, dw=1, dh=1, palette ="Spectral11",
         source=img_source)

img_source.stream(dict(vol=[data]))

curdoc().add_root(p)