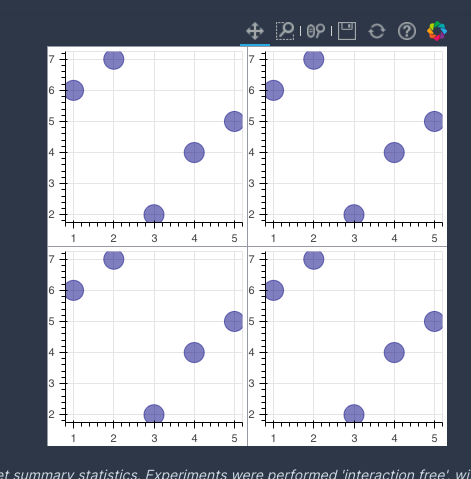
I’m embedding plots in a webpage with a dark theme. I’ve noticed when using layouts.gridplot there appears to be a thin transparent border/gap around each plot in the layout. Naturally this isn’t ordinarily noticeable when the plots have a white background and border and are embedded on a page with a light background.

from bokeh.plotting import figure
from bokeh.layouts import gridplot

plots = list()
for _ in range(4):
    p = figure(width=200, height=200)
    p.circle([1, 2, 3, 4, 5], [6, 7, 2, 4, 5], size=20, color="navy", alpha=0.5)
    plots.append(p)
p = gridplot(plots, ncols=2)