Thinning of CategoricalAxes tick labels

Hello,

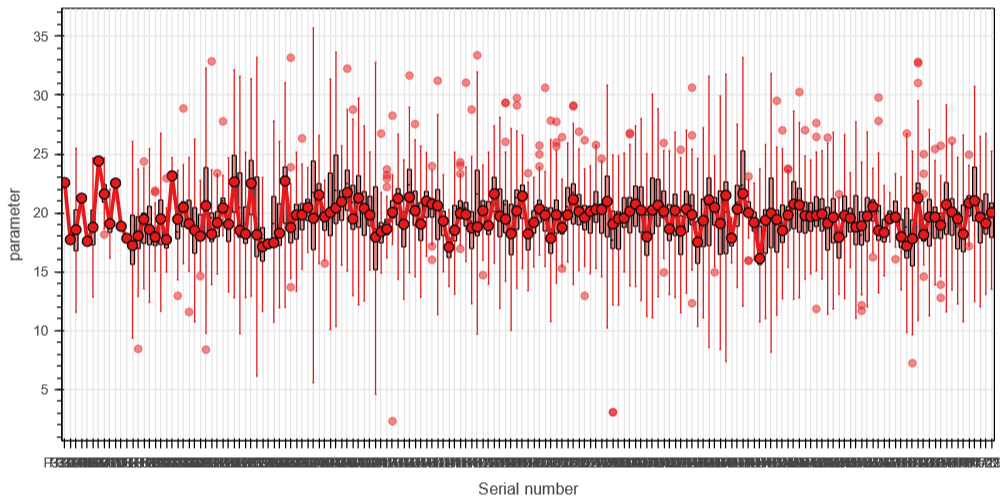
I have a plot that has some ordered sequence of strings (say, serial numbers of experiments) at x-axis. The sequence can be mapped to a (continuous?) integer series.

As far as I understand, CategoricalAxes are usually used for this.

Unfortunately, when there are a lot of such categories, visual overlap occurs.

Is there any “idiomatic way” for visual thinning of xticklabels for CategoricalAxes at current scale (like for DateTimeAxis or LinearAxis) so that recalculation to a new scale occurs when zooming?

Moreover I think the LinearAxis is more suitable if the mapping like {int xvalue : str view} is possible.

@dinya Have you tested major_label_overrides? (link). Maybe that can be used.

The example below use idx field in the CDS as x values (integers) for placing the data, but uses the x field for the axis label.

import numpy as np
from bokeh.io import output_file, save
from bokeh.plotting import figure
from bokeh.models import ColumnDataSource

output_file('page.html')

alpha = list('abcdefghijklmnopqrstuvwxyz')
data = {
    'x': alpha,
    'idx': list(range(len(alpha))),
    'y': np.random.rand(len(alpha))
}

src = ColumnDataSource(data = data)

p = figure(width = 300)
p.circle(x = 'idx', y = 'y', alpha = 0.7, source = src)

p.xaxis.major_label_overrides = {
    i: a for i, a in zip(data['idx'], data['x'])
}
p.xaxis.minor_tick_line_color = None

save(p)
1 Like

@Jonas_Grave_Kristens Thanks a lot.

But how to hide floats between idx-ticks and outside the idx range?

1 Like

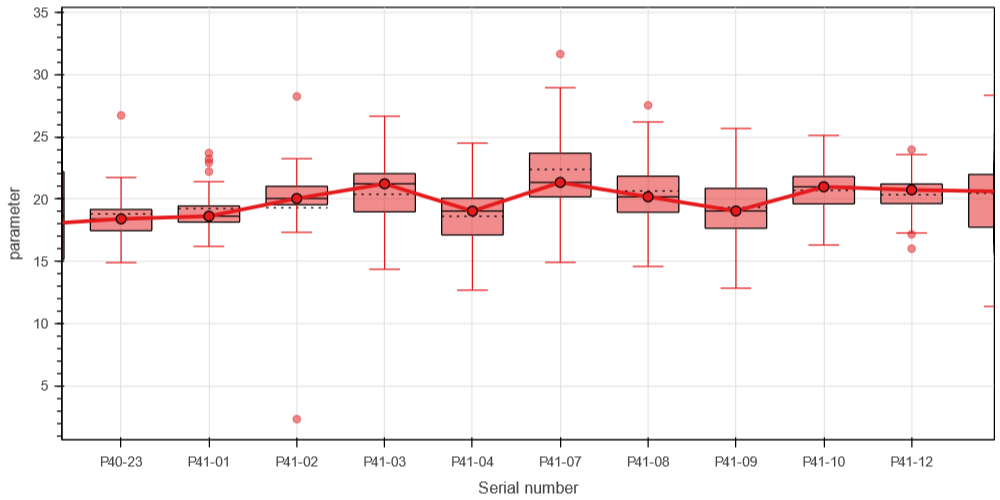
@dinya You can use bounds to limit axis labels to just a certain range (link, link). And you can use min_interval on an axis ticker to control interval between ticks (link).

p.xaxis.bounds = (min(data['idx']), max(data['idx']))
p.xaxis.ticker.min_interval = 1
2 Likes

@Jonas_Grave_Kristens Your recipes are exactly what I need :slight_smile:. Thank you!

1 Like