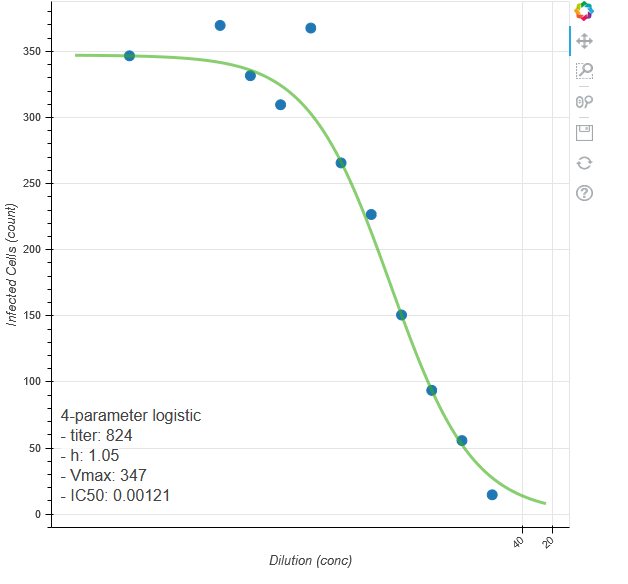
Hey All - I’ve got ticker questions. I’ve got a log base 2 series of numbers which map nicely to the series 5*2^-n, n in (0, 17), typically. These are dilution numbers, often represented as their inverse titer, so I want to display values like 5, 10, 20, 40, 80, 160…
I’ve got a formatter that gets the display right, if the ticks are right. If I use the log ticker with base 2, I get predictable values of 2^n displayed.
I’ve got a line like p.xaxis.ticker = AdaptiveTicker(mantissas=[1/40], base=2, min_interval=1/40, desired_num_ticks=8)
which crowds a bunch of ticks at the right edge of my graph, so clearly that’s not what I want. Most of the time my most concentrated sample will be a titer of 1/80, so I’d want a ticks between 1/40 and 1/655360 spaced by 1/4.
I can do this with a fixed ticker, but then I hard code something that I’d really love to be adaptive.
Suggestions?
J
