Bryan!
I used your suggestion to update timeline-category chart. The data update works very nicely, however, the timeline axis shows bogus numbers. For example:
First I show this chart
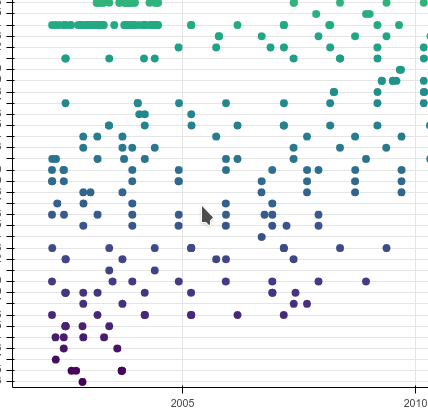
The time line looks nice going from year 2002-2010
Then I select year 2004 from a select box, and the data refreshes in the chart and is redrawn showing data only from 2004, but as you can see below, the timeline axis is pretty screwed up.
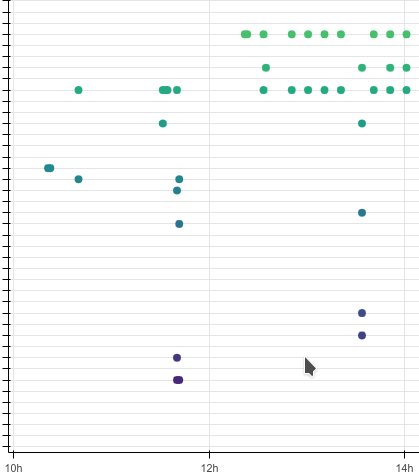
Also is it possible to resample the categories on the y axis and eliminate those that do not contain any datapoint?
Csaba