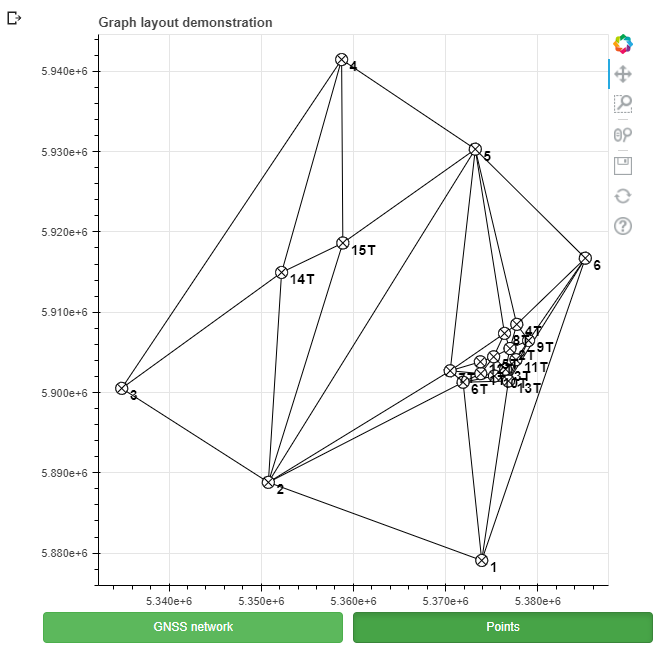
Hi everybody, I recently started using bokeh. I wanted to create a network graph. This graph shows the measurement vectors of GPS coordinates of points on the surface. I used bokeh documentation about " Visible property" https://docs.bokeh.org/en/latest/docs/user_guide/styling.html#visible-property. I’ve made 2 Toggle buttons. They are responsible for hiding the points themselves and the network graphs. But Toggle for network grapsh is not working. Although I can hide the whole network with next code graph.visible = False
Here is the main code:
plot_plot = figure(title="Graph layout demonstration")

graph = GraphRenderer()
node_indices = [i for i in range(1,22)]

graph.edge_renderer.data_source.data = dict(
    start=df_network_graph['start'],
    end=df_network_graph['end'])

x = list(df_gnss_plot['X_wmerc'])
y = list(df_gnss_plot['Y_wmerc'])

graph_layout = dict(zip(node_indices, zip(x, y)))

graph.layout_provider = StaticLayoutProvider(graph_layout=graph_layout)

# render the graph
plot_plot.renderers.append(graph)

circles = plot_plot.circle_x(x='X_wmerc',
             y='Y_wmerc',
             size=12,
             color='black',
             fill_color="white",
             fill_alpha=1,
           source=source)
labels_graphs = LabelSet(x='X_wmerc', y='Y_wmerc', text='reper',
              x_offset=8, y_offset=-15, source=source, render_mode='canvas', text_color='black', text_font_size = {'value': '14px'}, text_font_style='bold')
plot_plot.add_layout(labels_graphs)

#graph.visible = False

toggle2 = Toggle(label="GNSS network", button_type="success", active=True)
toggle2.js_link('active', graph, 'visible')

toggle3 = Toggle(label="Points", button_type="success", active=True)
toggle3.js_link('active', circles, 'visible')

#display the plot
#show(plot_plot)
show(layout([plot_plot], [toggle2, toggle3]))