Hi,
I’m working on a personal implementation of a Horizon Chart with Bokeh and I took the ridge_plot as baseline example to accomplish something similar to this graph. Note that I’m not on the overlaying part yet, which I’m planning to code later using varea. For now I just wanted a layout with multiple plots. So far, so good!
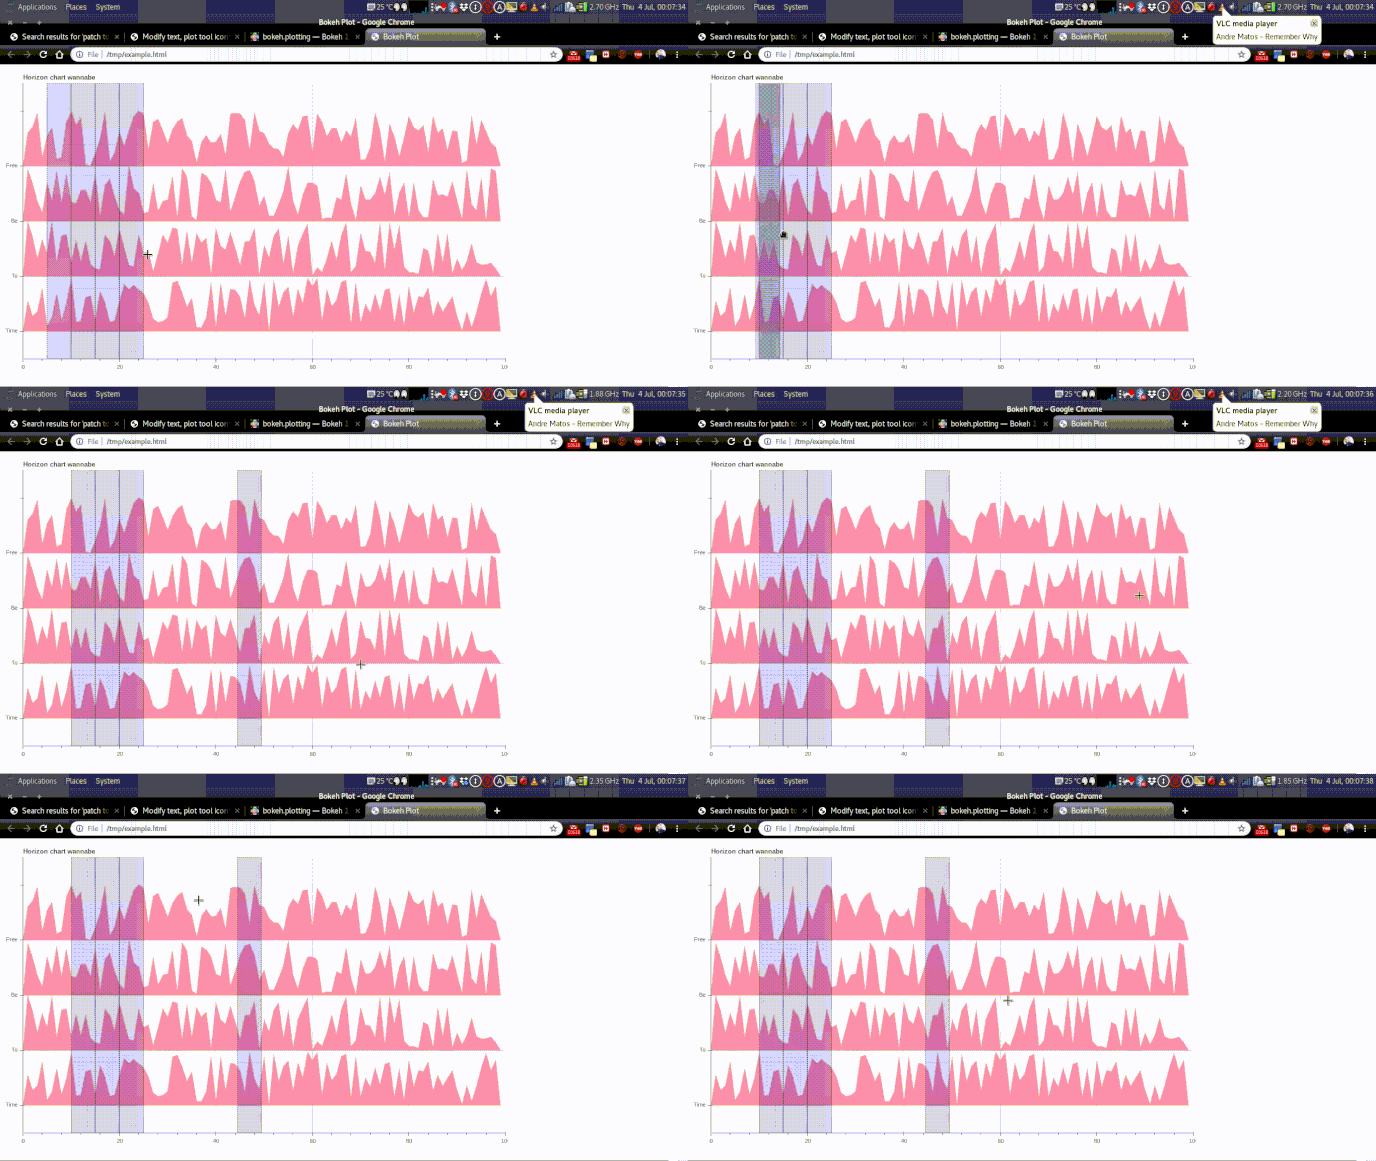
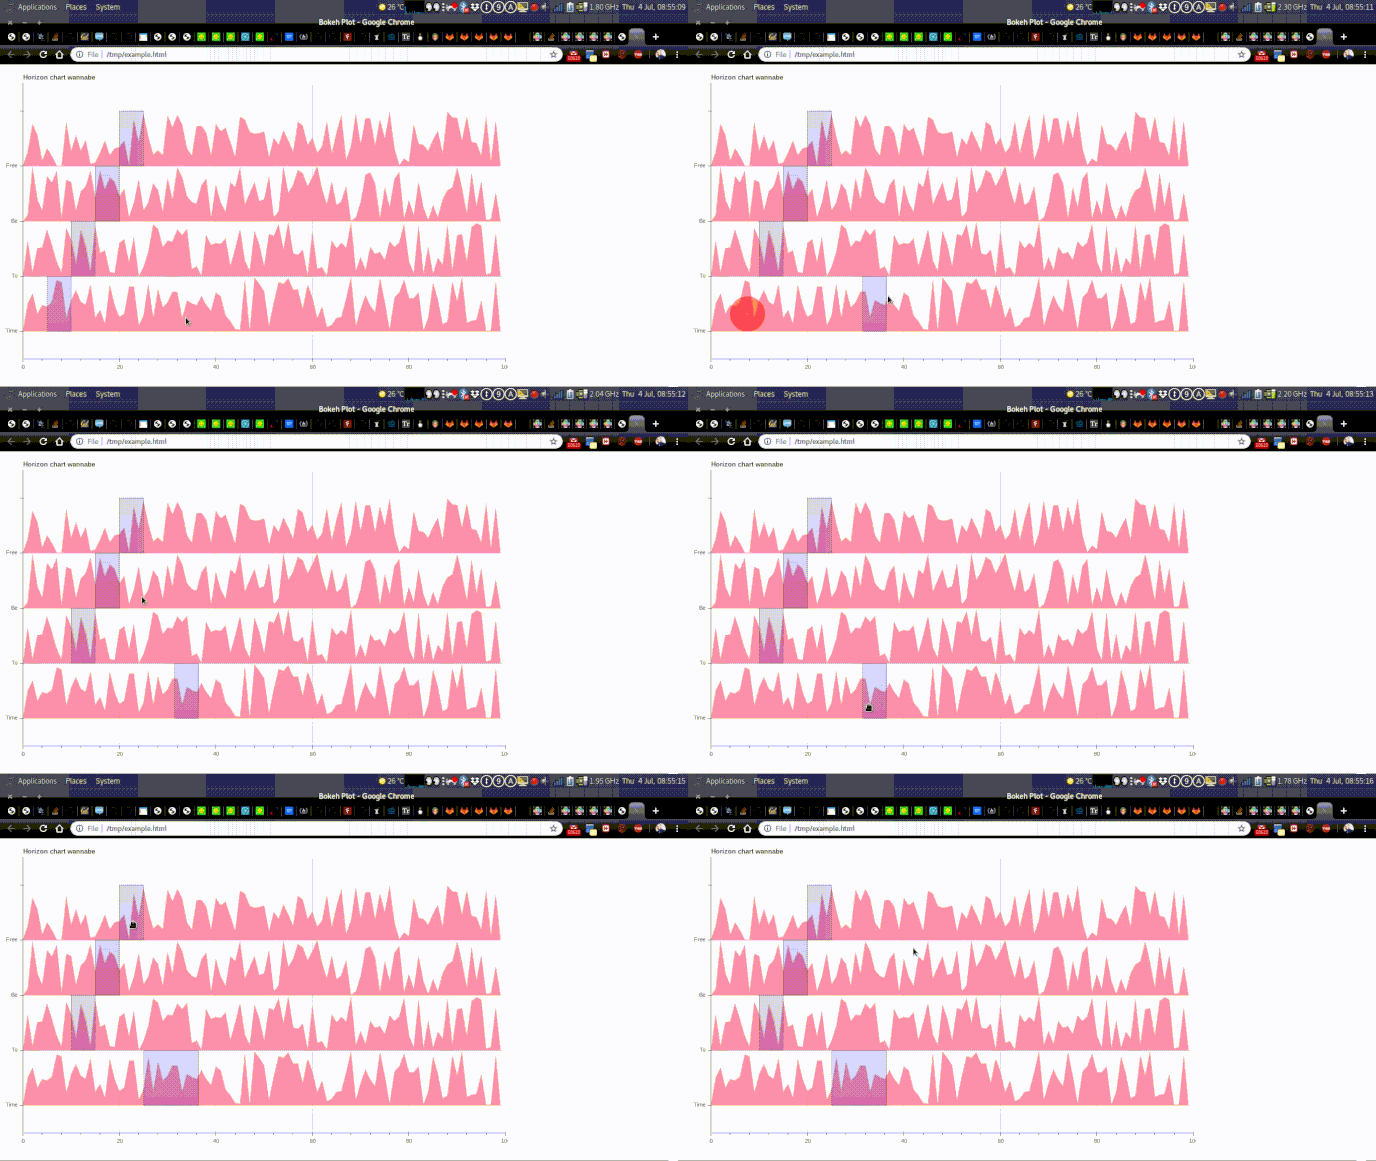
However, I also wanted to add some tools like HoverTool and mainly the RangeTool. To be more clear, I wanted a RangeTool shaded region for each patch of my plot and I don’t know how can I do that. Even the Hovertool, which has a renderers attribute that works well for independent bars with vbar_stack as seen at this example, does not seem to work. On the other hand, only the first RangeTool object works, but it does on all patches in figure at once, which is undesired since I wanted to drag independent regions.
There’s a full example code below with the result as a GIF.
from bokeh.models import ColumnDataSource, RangeTool, Range1d, HoverTool
from bokeh.plotting import figure
from bokeh.io import show

import numpy as np

NPOINTS = 100
labels = ['Time','To','Be','Free']

def ridge(category, data=None, scale=1.0):
    return list(zip([category]*len(data), scale*data))

p = figure(title='Horizon chart wannabe',
        y_range=labels + [''],
        tools='hover',
        x_range=(0, NPOINTS),
        plot_width=1000, plot_height=600,
        toolbar_location=None)

for i, lab in enumerate(labels):
    source = ColumnDataSource(data=dict(x=np.arange(NPOINTS),))
    vector = np.random.rand(NPOINTS-2)
    vector = np.insert(vector, 0, 0) # FIXME
    vector = np.append(vector, 0)    # FIXME
    y = ridge(lab, data=vector)
    source.add(y, lab)

    renderer = p.patch('x', lab, name=lab,
            color='red', line_color='red',
            fill_alpha=0.4, line_alpha=0.1,
            source=source)

    range_tool = RangeTool(x_range=Range1d((i+1)*5,(i+1)*5+5))
    range_tool.overlay.fill_color = "navy"
    range_tool.overlay.fill_alpha = 0.2

    hover_tool = HoverTool(tooltips=[
            ('x', '@x'),
        ], renderers=[renderer])

    p.add_tools(range_tool)
    p.add_tools(hover_tool)

show(p)

