from bokeh.models import HoverTool
from bokeh.plotting import figure, show, output_file
from bokeh.models import Range1d
fill_color = []
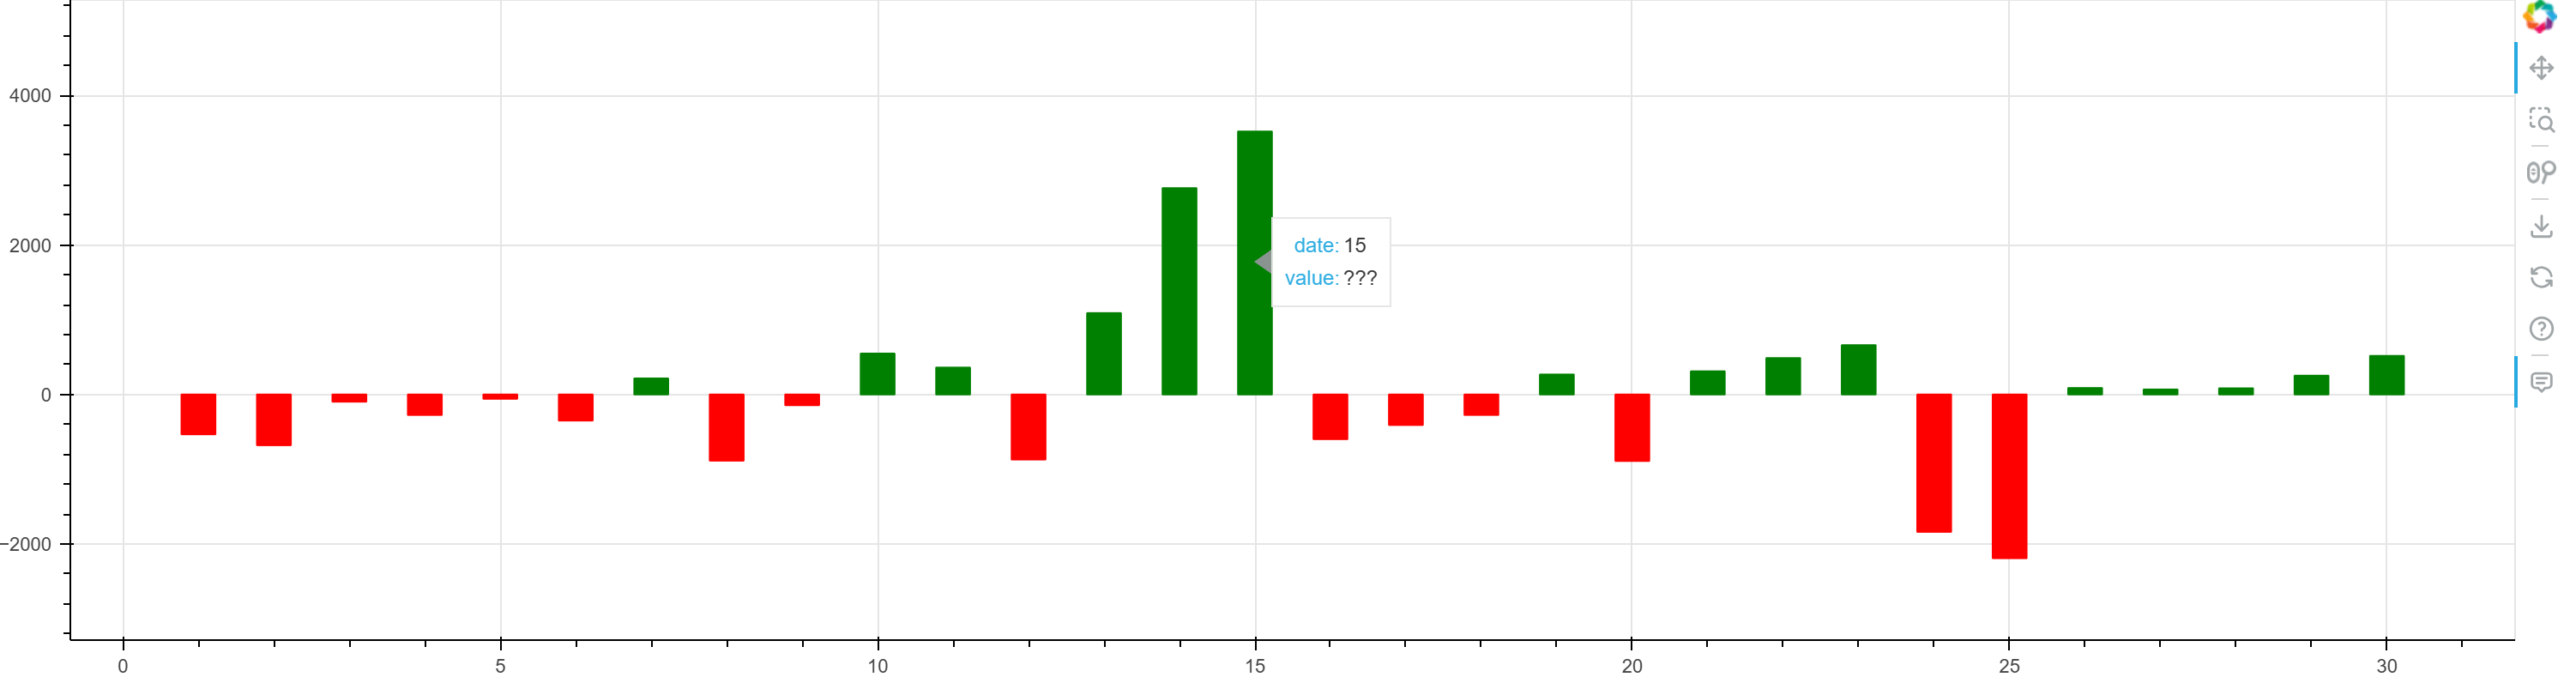
y= [ -533.1, -679.3, -96.6, -274.8, -58.1, -349.3, 215,
-885.7, -143.7, 547.9, 360.3, -870.6, 1089, 2760.5,
3518.1, -598, -408.7, -274.3, 267.5, -890.1, 310.5,
487.4, 660, -1838.1, -2190.6, 86.9, 67.2, 82.7,
251.8, 516.4]
for a in y:
if a >= 0:
fill_color.append('green')
elif a < 0:
fill_color.append('red')
x=[1, 2, 3, 4, 5, 6, 7, 8, 9, 10, 11, 12, 13, 14, 15, 16, 17, 18, 19, 20, 21, 22, 23, 24, 25, 26, 27, 28, 29, 30]
p = figure(width=1500, height=400)
hover = HoverTool(tooltips=[('date', '@x'), ('value', '@y')])
p.add_tools(hover)
p.vbar(x=x, width=0.45, bottom=0, top=y, color = fill_color)
p.y_range = Range1d(1.5 * min(y), 1.5 * max(y))
show(p)
When you create an explicit ColumnDataSource yourself, you have complete control over the column names. When (as above) you pass in raw data to glyphs and rely on Bokeh to construct a ColumnDataSource for you, then Bokeh always uses the property names of the glyph as the column names. VBar does not have any property named y. In this case you presumably want:
HoverTool(tooltips=[('date', '@x'), ('value', '@top')])
For more information: Data sources — Bokeh 3.6.2 Documentation
Problem solved, thank you very much. ![]()