I’m running Bokeh 0.11.0 on Mac OS X 10.10.4 with Python 3.4. I have the following code in a Jupyter Notebook:
from bokeh.charts import Bar, show, output_notebook
import pandas as pd
output_notebook()
data_dict = { ‘numstudents’ : [43, 22, 1,
2, 54, 9,
18, 10, 5,
14, 12, 3,
15, 11, 1,
14, 8, 2],
‘language’ : [‘Matlab’,‘Matlab’,‘Matlab’,
‘C/C++’,‘C/C++’,‘C/C++’,
‘Java’,‘Java’,‘Java’,
‘HTML/CSS’,‘HTML/CSS’,‘HTML/CSS’,
‘Python’,‘Python’,‘Python’,
‘Javascript’,‘Javascript’,‘Javascript’],
‘skill_level’ : [‘Beginner’,‘Intermediate’,‘Expert’,
‘Beginner’,‘Intermediate’,‘Expert’,
‘Beginner’,‘Intermediate’,‘Expert’,
‘Beginner’,‘Intermediate’,‘Expert’,
‘Beginner’,‘Intermediate’,‘Expert’,
‘Beginner’,‘Intermediate’,‘Expert’]
}
data_df = pd.DataFrame(data_dict)
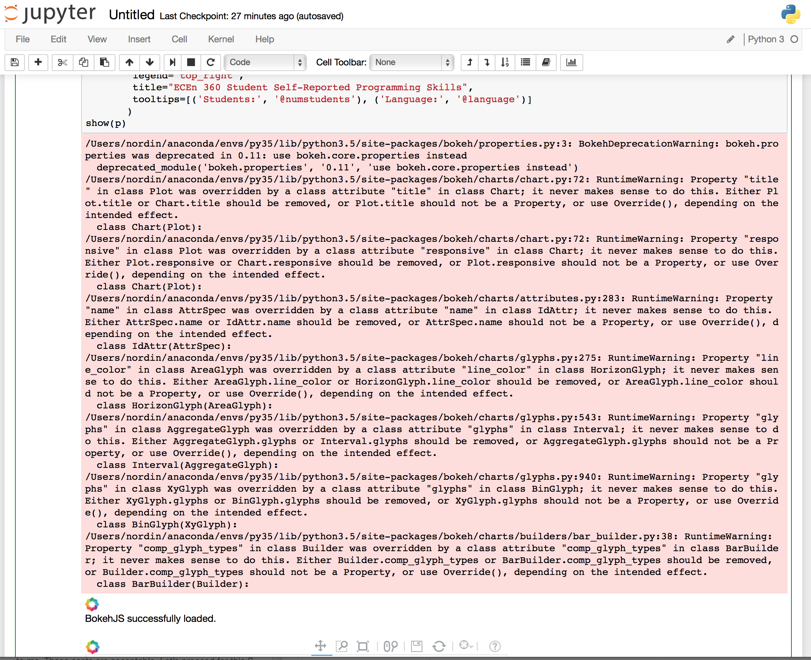
p = Bar(data_df,
values=‘numstudents’,
label=‘language’,
stack=‘skill_level’,
legend=‘top_right’,
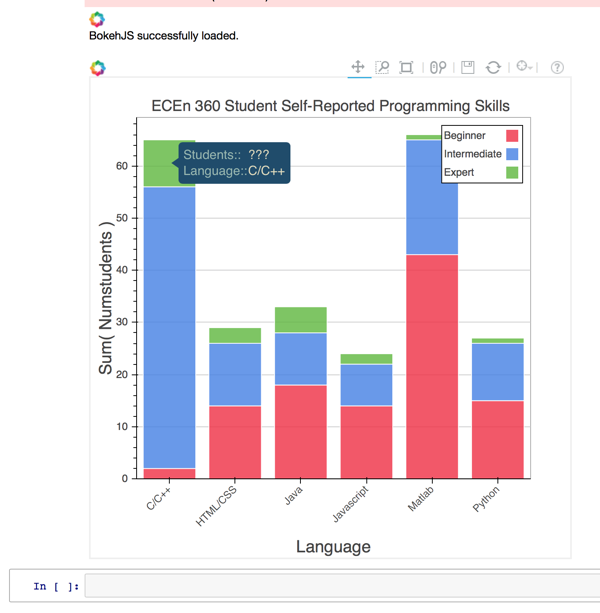
title=“ECEn 360 Student Self-Reported Programming Skills”,
tooltips=[(‘Students:’, ‘@numstudents’), (‘Language:’, ‘@language’)]
)
show(p)
The plot builds and displays just fine. The problem I am having is with the tooltip information as illustrated in the upper left of the plot image below. Note that to the right of “Students:” is “???” rather than the number of students at that skill level for that language (in this case it should be the number 9). Why does this not work? My understanding from the documentation is that ‘@numstudents’ should refer to the column ‘numstudents’, but the tooltip doesn’t pick up the value from the column as it should, and as it correctly does in the case of the ‘language’ column.
Thanks,
Greg