Transform data with CDSView

Hi,

I have a plot which selects data with CDSView. I would like to plot a subplot below with the selected data transformed. I can see it plots the selected data (from CDSView). Is it possible to transform only the data selected data by user via multiselect tools etc.

CoVar = CustomJSTransform(args=dict(source=source), v_func=v_func)

p2.line(x='Average_time_hours', y=transform('Release [mg/(cm2*d)]', CoVar), line_width=2,
         color='blue', alpha=0.6,legend_label="Coefficiant of Variance [%]", source=source, view=CDSView(source=source, filters=[tempInt_filter, tc_filter, mn_filter, mc_filter]))

Not entirely sure what you mean, but this seems like it.

from bokeh.io import show
from bokeh.layouts import column
from bokeh.models import ColumnDataSource, CDSView, BooleanFilter, CustomJSTransform, MultiSelect, CustomJS
from bokeh.plotting import figure
from bokeh.transform import transform

p = figure()
ds = ColumnDataSource(dict(x=list(range(10)), y=list(range(10))))
p.scatter('x', 'y', source=ds)
b = BooleanFilter(booleans=[x % 2 == 0 for x in ds.data['x']])
view = CDSView(source=ds, filters=[b])
tr = CustomJSTransform(v_func="return xs.map(x => x * x);")
p.scatter('x', transform('y', tr), view=view, source=ds, color='red')

ms = MultiSelect(options=['odd', 'even'], value=['odd', 'even'])

ms.js_on_change('value', CustomJS(args=dict(b=b, ds=ds),
                                  code="""\
                                      const [odd, even] = ['odd', 'even'].map(i => cb_obj.value.includes(i));
                                      let fn;
                                      if (odd && even) fn = (_) => true;
                                      else if (odd)    fn = (x) => x % 2 == 1;
                                      else if (even)   fn = (x) => x % 2 == 0;
                                      else             fn = (_) => false;
                                      b.booleans = ds.data.x.map(fn);
                                      ds.change.emit();
                                  """))

show(column(p, ms))

Ok, think I figured it out. Just used what you showed me before and changed a little. This worked:

from bokeh.io import show
from bokeh.layouts import column
from bokeh.models import ColumnDataSource, CDSView, BooleanFilter, CustomJSTransform, MultiSelect, CustomJS
from bokeh.plotting import figure
from bokeh.transform import transform
import numpy as np

p = figure()
ds = ColumnDataSource(dict(x=list(range(10)), y=list(range(10)), names = ['a', 'b', 'c', 'c', 'd', 'd', 'a', 'a', 'c', 'c']))
#p.scatter('x', 'y', source=ds)
b = BooleanFilter([True if x == 'a' else False for x in ds.data['names']])

selectoroptions = [str(x) for x in sorted(np.unique(ds.data['names']))]
ms = MultiSelect(title= 'MC Experiment:', value = ['a'],
                                    options=selectoroptions)

ms.js_on_change('value', CustomJS(args = dict(f=b, source=ds, columnName = 'names'),
                                      code="""\
                                      const val = cb_obj.value;
                                      f.booleans = Array.from(source.data[columnName]).map(d =>  val.includes(d != null && d.toString()));
                                      source.change.emit();                                      
                                      """))


view = CDSView(source=ds, filters=[b])
tr = CustomJSTransform(v_func="return xs.map(x => 10 * x);")
p.scatter('x', transform('y', tr), view=view, source=ds, color='red')

show(column(p, ms))
1 Like

I realized now its not working as I would like, its still taking all the data and running the transform function. I would like it to only run on the selected data. Because my v_func code takes an average of selected data and will change depending on what the user selects. Now its taking all the data and calculating an average.
You have an idea how to fix that?


    function average(data){
        var totalSum = 0;
            for(var i in data) {
            totalSum += data[i];
        }
    return totalSum / data.length;
    }
    
    var avg = average(xs)
    console.log(xs)
    //var stdDev = Math.sqrt(average((value - avg) * (value - avg)))
 
    const CoVar = new Float64Array(xs.length)
    for (let i = 0; i < xs.length; i++) {
         CoVar[i] = Math.sqrt((xs[i] - avg) * (xs[i] - avg)/avg);
    }
    console.log(CoVar)

Oh, huh, I see. That’s an interesting question, I’ll look into it tomorrow.

1 Like

Related: `transform.cumsum` doesn't take into account the CDSView · Issue #8023 · bokeh/bokeh · GitHub

To work around that you can pass a view directly to the transform and use the already computed indices.

import numpy as np

from bokeh.io import show
from bokeh.layouts import column
from bokeh.models import ColumnDataSource, CDSView, BooleanFilter, CustomJSTransform, MultiSelect, CustomJS
from bokeh.plotting import figure
from bokeh.transform import transform

p = figure()
ds = ColumnDataSource(dict(x=list(range(10)),
                           y=list(range(10)),
                           names=['a', 'b', 'c', 'c', 'd', 'd', 'a', 'a', 'c', 'c']))
init_val = 'a'
b = BooleanFilter([x == init_val for x in ds.data['names']])

ms = MultiSelect(title='MC Experiment:', value=[init_val],
                 options=sorted(np.unique(ds.data['names'])))

ms.js_on_change('value', CustomJS(args=dict(f=b, source=ds, columnName='names'),
                                  code="""\
                                      const val = cb_obj.value;
                                      f.booleans = (Array.from(source.data[columnName])
                                                    .map(d => val.includes(d != null && d.toString())));
                                      source.change.emit();                                      
                                  """))

view = CDSView(source=ds, filters=[b])
tr = CustomJSTransform(args=dict(view=view),
                       v_func="""\
                           // Cannot filter here because a transform
                           // has to return the same amount of elements.
                           return xs.map((x, idx) => {
                               if (view.indices.includes(idx)) {
                                   return x * 10;
                               }
                               return null;
                           });
                       """)
p.scatter('x', transform('y', tr), view=view, source=ds, color='red')

show(column(p, ms))

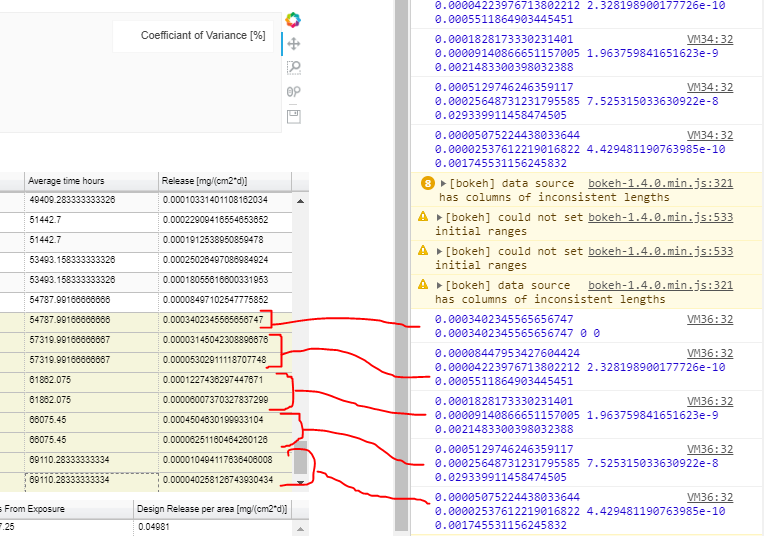
Thanks for the help! I modified the code and I am printing the results in the console, I can see the length of the CoVar function is 122 (which is correct) it has an array full of values, but its not plotting it agains the x-values (see image below). Does it have to do with the selected indices?
I added the v_func below.


view=CDSView(source=source, filters=[tempInt_filter, tc_filter, mn_filter, mc_filter])

v_func="""\
                           // Cannot filter here because a transform
                           // has to return the same amount of elements.
                           
                           var avg = 0;
                           //source.data['Average_time_hours'].map((x, idx) => {
                           xs.map((x, idx) => {
                               if (view.indices.includes(idx)) {
                                   avg += xs[idx]
                                   //return console.log(x, xs[idx], avg);
                               }
                               return null;
                           });
                           
                           console.log(avg / view.indices.length, avg, view.indices.length)
                           avg = avg / view.indices.length
                           const CoVar = new Float64Array(view.indices.length)                           
                           //source.data['Average_time_hours'].map((x, idx) => {
                           xs.map((x, idx) => {
                               if (view.indices.includes(idx)) {
                                    console.log(avg, xs[idx], Math.pow((xs[idx] - avg), 2))
                                    for (let i = 0; i < view.indices.length; i++) {
                                        CoVar[i] = Math.pow((xs[idx] - avg), 2);
                                    }
                               }
                               return null;
                           });

                           console.log(CoVar)
                           return CoVar
"""

CoVar = CustomJSTransform(args=dict(view=view, source = source), v_func=v_func) #"return xs.map(x => 10 * x);")
p2.scatter(x='Average_time_hours', y=transform('Release [mg/(cm2*d)]', CoVar),view = view, source=source, line_width=2,
         color='blue', alpha=0.6,legend_label="Coefficiant of Variance [%]")

In your CustomJSTransform code, you return a collection that has fewer elements than the xs variable. That’s not supported - that’s what I meant by that comment about the same amount of elements.

I’m afraid that in this case you will have to use an additional data source instead of a view and a filter. And just populate that second data source whenever the first one changes.

Hi, I think I tried something like that before and couldnt get it working. Do you mean create a new empty source and populate it with selected data. I added the code I tried… javascript is tough :stuck_out_tongue:

I assume I am doing something wrong in the mc_multi_select js part. When I print in the console the array is empty. You have an idea what I am doing wrong?

sourceSel = ColumnDataSource(data=dict(avgtime = [], rel = []))

mc_multi_select.js_on_change('value', CustomJS(args = dict(f=mc_filter, source=source, sourceSel = sourceSel, columnName = 'MC_Name'),
                                      code="""\
                                      const val = cb_obj.value;
                                      var dsel = sourceSel.data;
                                      dsel['avgtime'] = []
                                      dsel['rel'] = []

                                      f.booleans = Array.from(source.data[columnName]).map(d =>  val.includes(d != null && d.toString()));
                                      source.change.emit();
                                                                            
                                      dsel['avgtime'].push(source.data['Average_time_hours'])
                                      dsel['rel'].push(source.data['Release [mg/(cm2*d)]'])
                                      
                                      sourceSel.change.emit();
                                    
                                      """))

v_func="""

                           console.log(xs)
                           const CoVar = new Float64Array(xs.length)                           
                           for (let i = 0; i < xs.length; i++) {
                                CoVar[i] = Math.pow((xs[i] - 0.00124924104676287), 2);
                                }
                           console.log(CoVar)
                           return CoVar
"""

CoVar = CustomJSTransform(v_func=v_func) #"return xs.map(x => 10 * x);")
p2.scatter(x='avgtime', y=transform('rel', CoVar), source=sourceSel, line_width=2,
         color='blue', alpha=0.6,legend_label="Coefficiant of Variance [%]")

You don’t need to use CustomJSTransform and the filter for this at all.
All you have to do in the js_on_change is to iterate over the values in source, check whether they must go into the data for p2.scatter, and if so, put them in the sourceSel.

So should I just add the v_func inside the js_on_change part?
When I run the below part the console.log(xs) turn out empty. Am I not properly changing the sourceSel? It seems like its not pushing the values to the source.

mn_multi_select.js_on_change('value', CustomJS(args = dict(f=mn_filter, f_fd = mn_filter_fd, source=source, sourceSel = sourceSel, source_fd = source_fd, columnName = 'Matrix_Name'),
                                      code="""\
                                          const val = cb_obj.value;

                                          f.booleans = Array.from(source.data[columnName]).map(d =>  val.includes(d != null && d.toString()));
                                          f_fd.booleans = Array.from(source_fd.data[columnName]).map(d =>  val.includes(d != null && d.toString()));

                                          sourceSel['avgtime'] = [];
                                          sourceSel['rel'] = [];

                                          f.booleans.forEach(myFunction); 
                                          function myFunction(item, index) {
                                              if (item == true) {
                                                  //console.log(item, index);
                                                  sourceSel['avgtime'].push(source.data['Average_time_hours'][index])
                                                  sourceSel['rel'].push(source.data['Release [mg/(cm2*d)]'][index])
                                                
                                                  }
                                          }

                                          console.log(sourceSel['avgtime'].length);
                                                                                    
                                          source.change.emit();
                                          source_fd.change.emit();
                                          sourceSel.change.emit();
                                            
"""))

v_func="""

                           console.log(xs)
                           const CoVar = new Float64Array(xs.length)                           
                           for (let i = 0; i < xs.length; i++) {
                                CoVar[i] = Math.pow((xs[i] - 0.00124924104676287), 2);
                                }
                           console.log(CoVar)
                           return CoVar
"""

CoVar = CustomJSTransform(v_func=v_func) #"return xs.map(x => 10 * x);")
p2.scatter(x='avgtime', y=transform('rel', CoVar), source=sourceSel, line_width=2,
         color='blue', alpha=0.6,legend_label="Coefficiant of Variance [%]")

Ok, I have rewritten the code and fiddled a lot. I tried to have the code run a javascript calculation with js_on_change. See first attempt below. But nothing happened. My sourceSel is not populated (is empty) unless a user selects on the plot or in the table (in the code its updated here: source.selected.js_on_change(‘indices’, CustomJS(args=dict(source=source, sourceSel = sourceSel… ). Is there a way to have sourceSel be populated when the user selects the views?

My last attempt is below too added it as Nth attempt :stuck_out_tongue:
I went back to CustomJSTransform since I can at least see something being printed on the console.
I can see the values are being correctly calculated when the user selects values from the table. See attached image in the next post. Is there a way to just plot the values?
Cant seem to figure it out.

### First attempt ###
sourceSel.js_on_change('data', CustomJS(args=dict(source=sourceSel), code=v_func))
p2.scatter(x='avgtime', y="covar", source=sourceSel, line_width=2,
         color='blue', alpha=0.6,legend_label="Coefficiant of Variance [%] ")
### First attempt  END ###

### Nth attempt  ###

v_func="""

    avgtime = source.data['avgtime']
    rel = source.data['rel']
    source.data['covar'] = [];
    
    const unique = (value, index, self) => {
    return self.indexOf(value) === index
    }

    function getInd(arr, val) { 
    var index = [], i = -1; 
    var totalSum = 0;
    var std = 0;

    while ((i = arr.indexOf(val, i+1)) != -1) { 
        index.push(i);
        totalSum += rel[i];
        }
        
    avg = totalSum / index.length;        

    while ((i = arr.indexOf(val, i+1)) != -1) { 
        index.push(i);
        std += Math.pow((rel[i] - avg), 2)

        }
        
        covar = std * 100 / avg
        console.log(totalSum, avg, std, covar);
        return covar; 
    } 
    const uniqueTimes = avgtime.filter(unique)
    covar = uniqueTimes.forEach(timeval => getInd(avgtime, timeval));
"""

CoVar = CustomJSTransform(v_func=v_func, args=dict(source=sourceSel)) #"return xs.map(x => 10 * x);")
p2.scatter(x='avgtime', y=transform('rel', CoVar), source=sourceSel, line_width=2,
         color='blue', alpha=0.6,legend_label="Coefficiant of Variance [%]")

Hi p-himik! I cant seem to figure out how to populate a second data source whenever the first changes. Do you have an example code?

from bokeh.io import curdoc
from bokeh.layouts import column
from bokeh.models import ColumnDataSource, Button
from bokeh.plotting import figure

ds1 = ColumnDataSource(dict(x=[0], y=[0]))
ds2 = ColumnDataSource(dict(x=[0], y=[0]))

p = figure()
p.circle('x', 'y', source=ds1, alpha=0.7)
p.circle('x', 'y', source=ds2, alpha=0.7, color='red')

b = Button(label='Add a dot')


def add_dot():
    n = len(ds1.data['x'])
    ds1.stream(dict(x=[n], y=[n]))


b.on_click(add_dot)


def sync_data(attr, old, new):
    ds2.data = {k: [i / 2 for i in v] if k == 'y' else v
                for k, v in new.items()}


# Note that it works with `stream` above but
# it might not work with `stream` or `patch` called in JS,
# e.g. when you edit a cell in a data table.
ds1.on_change('data', sync_data)

curdoc().add_root(column(p, b))
1 Like

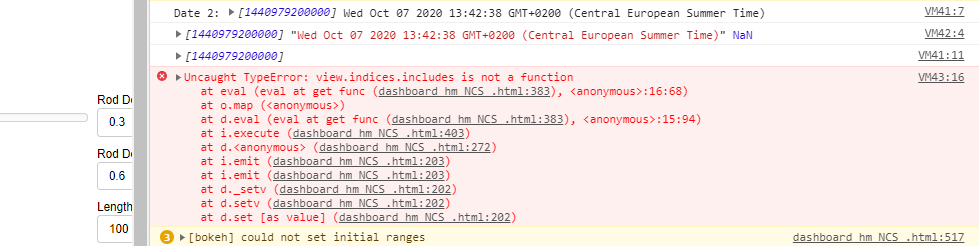
p-himik, dont know if this is a bit off topic but I have the standalone html files running on a seperate server. When the user opens the html files we get this error:

I dont have the issues generating the html files on my computer, but if the html files are generated on the other computer it causes this issue. Do you know what it could be?

I don’t know what’s going on since Array.prototype.includes should be available in all modern browsers that are not IE. You can just replace the call to includes with something that checks if an element is in an array.

Or, if that view.indices.includes comes from some Bokeh code and not from your JS code, then I think you will have to use a legacy Bokeh bundle to support IE. I don’t know any further details.

CDSView.indices is a (bit) set not an array (since 2.2). Besides this it’s an internal property, so one should use the data source instead, to obtain selection/inspection indices.

Huh…? Not entirely sure I understood that. I think on the other computer bokeh 2.2.1 was installed. I will update my version and see if I get the same error. But should I write the view.indices.includes in another way?

I think Mateusz means that you should use data_source.selection.indices instead - it should be an array.

1 Like