Depending on your requirements, you might be able to leverage Holoviz panel to accomplish this with bokeh content as well.
In principle, you can combine bokeh models and figures, plotly, and other functionality in panel. And since the panel server is the bokeh server under the hood, you have all of that functionality too.
bokeh is my go-to visualization framework, but I often find that complementing it with some extras from panel works quite well.
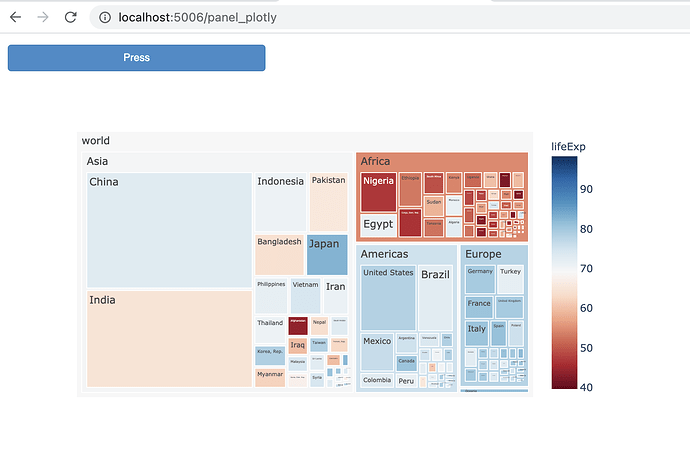
Here’s a very simple example using one of the plotly examples in the link you provided, combined with a bokeh button that just acknowledges that it was pressed, i.e. no link between the button and the treemap.
#!/usr/bin/env python3
# -*- coding: utf-8 -*-
"""
"""
import plotly.express as px
import numpy as np

from bokeh.models import Button
import panel as pn

pn.extension('plotly')


def press_cb():
    print("button press")

b = Button(button_type='primary', width=300, label='Press')
b.on_click(press_cb)


df = px.data.gapminder().query("year == 2007")
df["world"] = "world" # in order to have a single root node
fig = px.treemap(df, path=['world', 'continent', 'country'], values='pop',
                  color='lifeExp', hover_data=['iso_alpha'],
                  color_continuous_scale='RdBu',
                  color_continuous_midpoint=np.average(df['lifeExp'], weights=df['pop']))

ui = pn.Column(b, fig)
ui.servable()