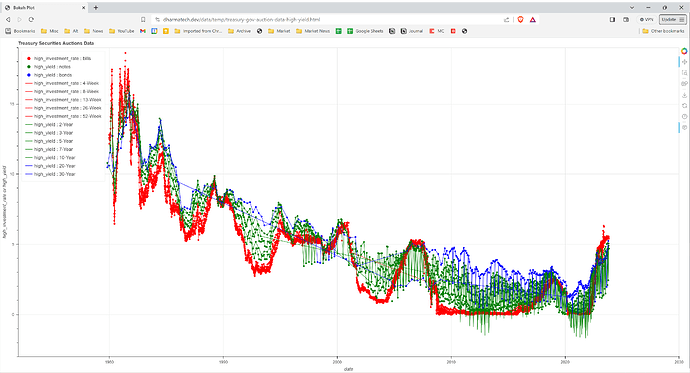
The treasury.gov site has a dataset for U.S. Treasury Securities Auctions Data.
Here’s a video demonstrating a chart which explores one of the fields in the auction data:
https://twitter.com/dharmatrade/status/1722029885722390973
As a new user here, I’m only allowed to post two links per post so I’ll include links to the chart and script in a follow up post. 
I’m new to Bokeh and Python so any suggestions regarding presentation of the data or implementation of the script are welcome.
1 Like
A link to the live bokeh chart is here:
https://dharmatech.dev/data/temp/treasury-gov-auction-data-high-yield.html
(Warning, it’s 18MB in size.)
The Python script that generated the chart:
A link to the dataset containing the source data on the U.S. Treasury site:
![]()
