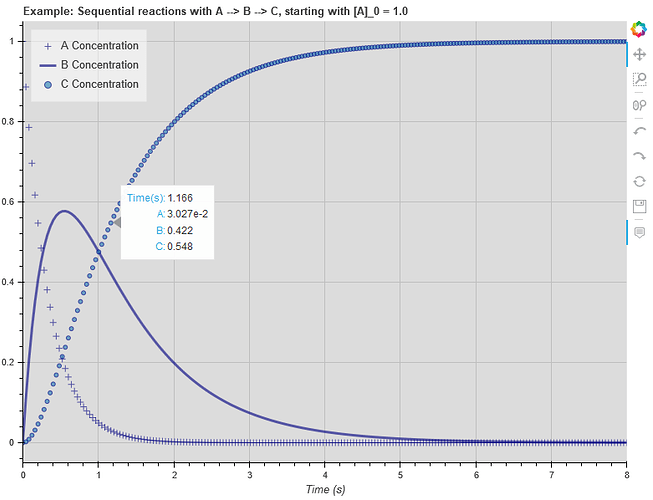
I am trying to add tooltips to my plot which has 3 concentrations of A, B and C changing over time. Following the guide.
source = ColumnDataSource(data=dict(vec_time=vec_time, int_vec_A=int_vec_A, int_vec_B=int_vec_B, int_vec_C=int_vec_C))

TOOLTIPS = [("Time(s)","$vec_time"), ("A","$int_vec_A"), ("B","$int_vec_B"), ("C","$int_vec_C")]

plot = figure(plot_height=600, plot_width=800, tools=TOOLS, tooltips=TOOLTIPS,
              title="Example: Sequential reactions with A --> B --> C, starting with [A]_0 = 1.0", x_range=[t_start, t_end], y_range=[-0.05, 1.05])
with more source code below and complete source code can be found at Github Link. The output of the interactive plot can be found here: Sequential_Reactions .
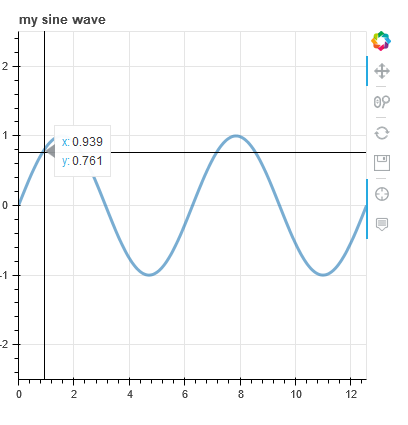
I am unable to generate any tooltips for this plot. I did recreate in other plots. For example, in sliders.py and other time series plots:

Not sure what I am doing wrong, any pointers appreciated.
# Solve ODE
vec_conc_t = odeint(dconc_dt, vec_conc_t0, vec_time, args=(params,))
int_vec_A = vec_conc_t[:,0]
int_vec_B = vec_conc_t[:,1]
int_vec_C = vec_conc_t[:,2]
source = ColumnDataSource(data=dict(vec_time=vec_time, int_vec_A=int_vec_A, int_vec_B=int_vec_B, int_vec_C=int_vec_C))
# Set up plot
TOOLTIPS = [("Time(s)","$vec_time"), ("A","$int_vec_A"), ("B","$int_vec_B"), ("C","$int_vec_C")]
TOOLS = "pan,undo,redo,reset,save,wheel_zoom,box_zoom"
plot = figure(plot_height=600, plot_width=800, tools=TOOLS, tooltips=TOOLTIPS,
              title="Example: Sequential reactions with A --> B --> C, starting with [A]_0 = 1.0", x_range=[t_start, t_end], y_range=[-0.05, 1.05])
plot.cross('vec_time', 'int_vec_A', source=source, size=8, alpha=0.6, color="navy", legend_label="A Concentration")
plot.line('vec_time', 'int_vec_B', source=source, line_width=3, line_alpha=0.6, line_color="navy", legend_label="B Concentration")
plot.circle('vec_time', 'int_vec_C', source=source, size=5, alpha=0.6, line_color="navy", legend_label="C Concentration")