I would like to have a common vertical y-axis label to the left of a grid of plots. With inspiration from the custom_attribution.py example that uses the new UI floating elements argument I have tried to add a Panel element to a Spacer object of width 50px to the left of the grid.
In the Panel I have added transform: rotate(270deg); to stylesheets in order to have the text be shown in vertical layout.
I have styled the Spacer with
:host(.spacer) {
      display: flex;
      justify-content: center;
      align-items: center;
      }
I can only get the label to show up if I use "parent" as target of the Node used for position in Panel.
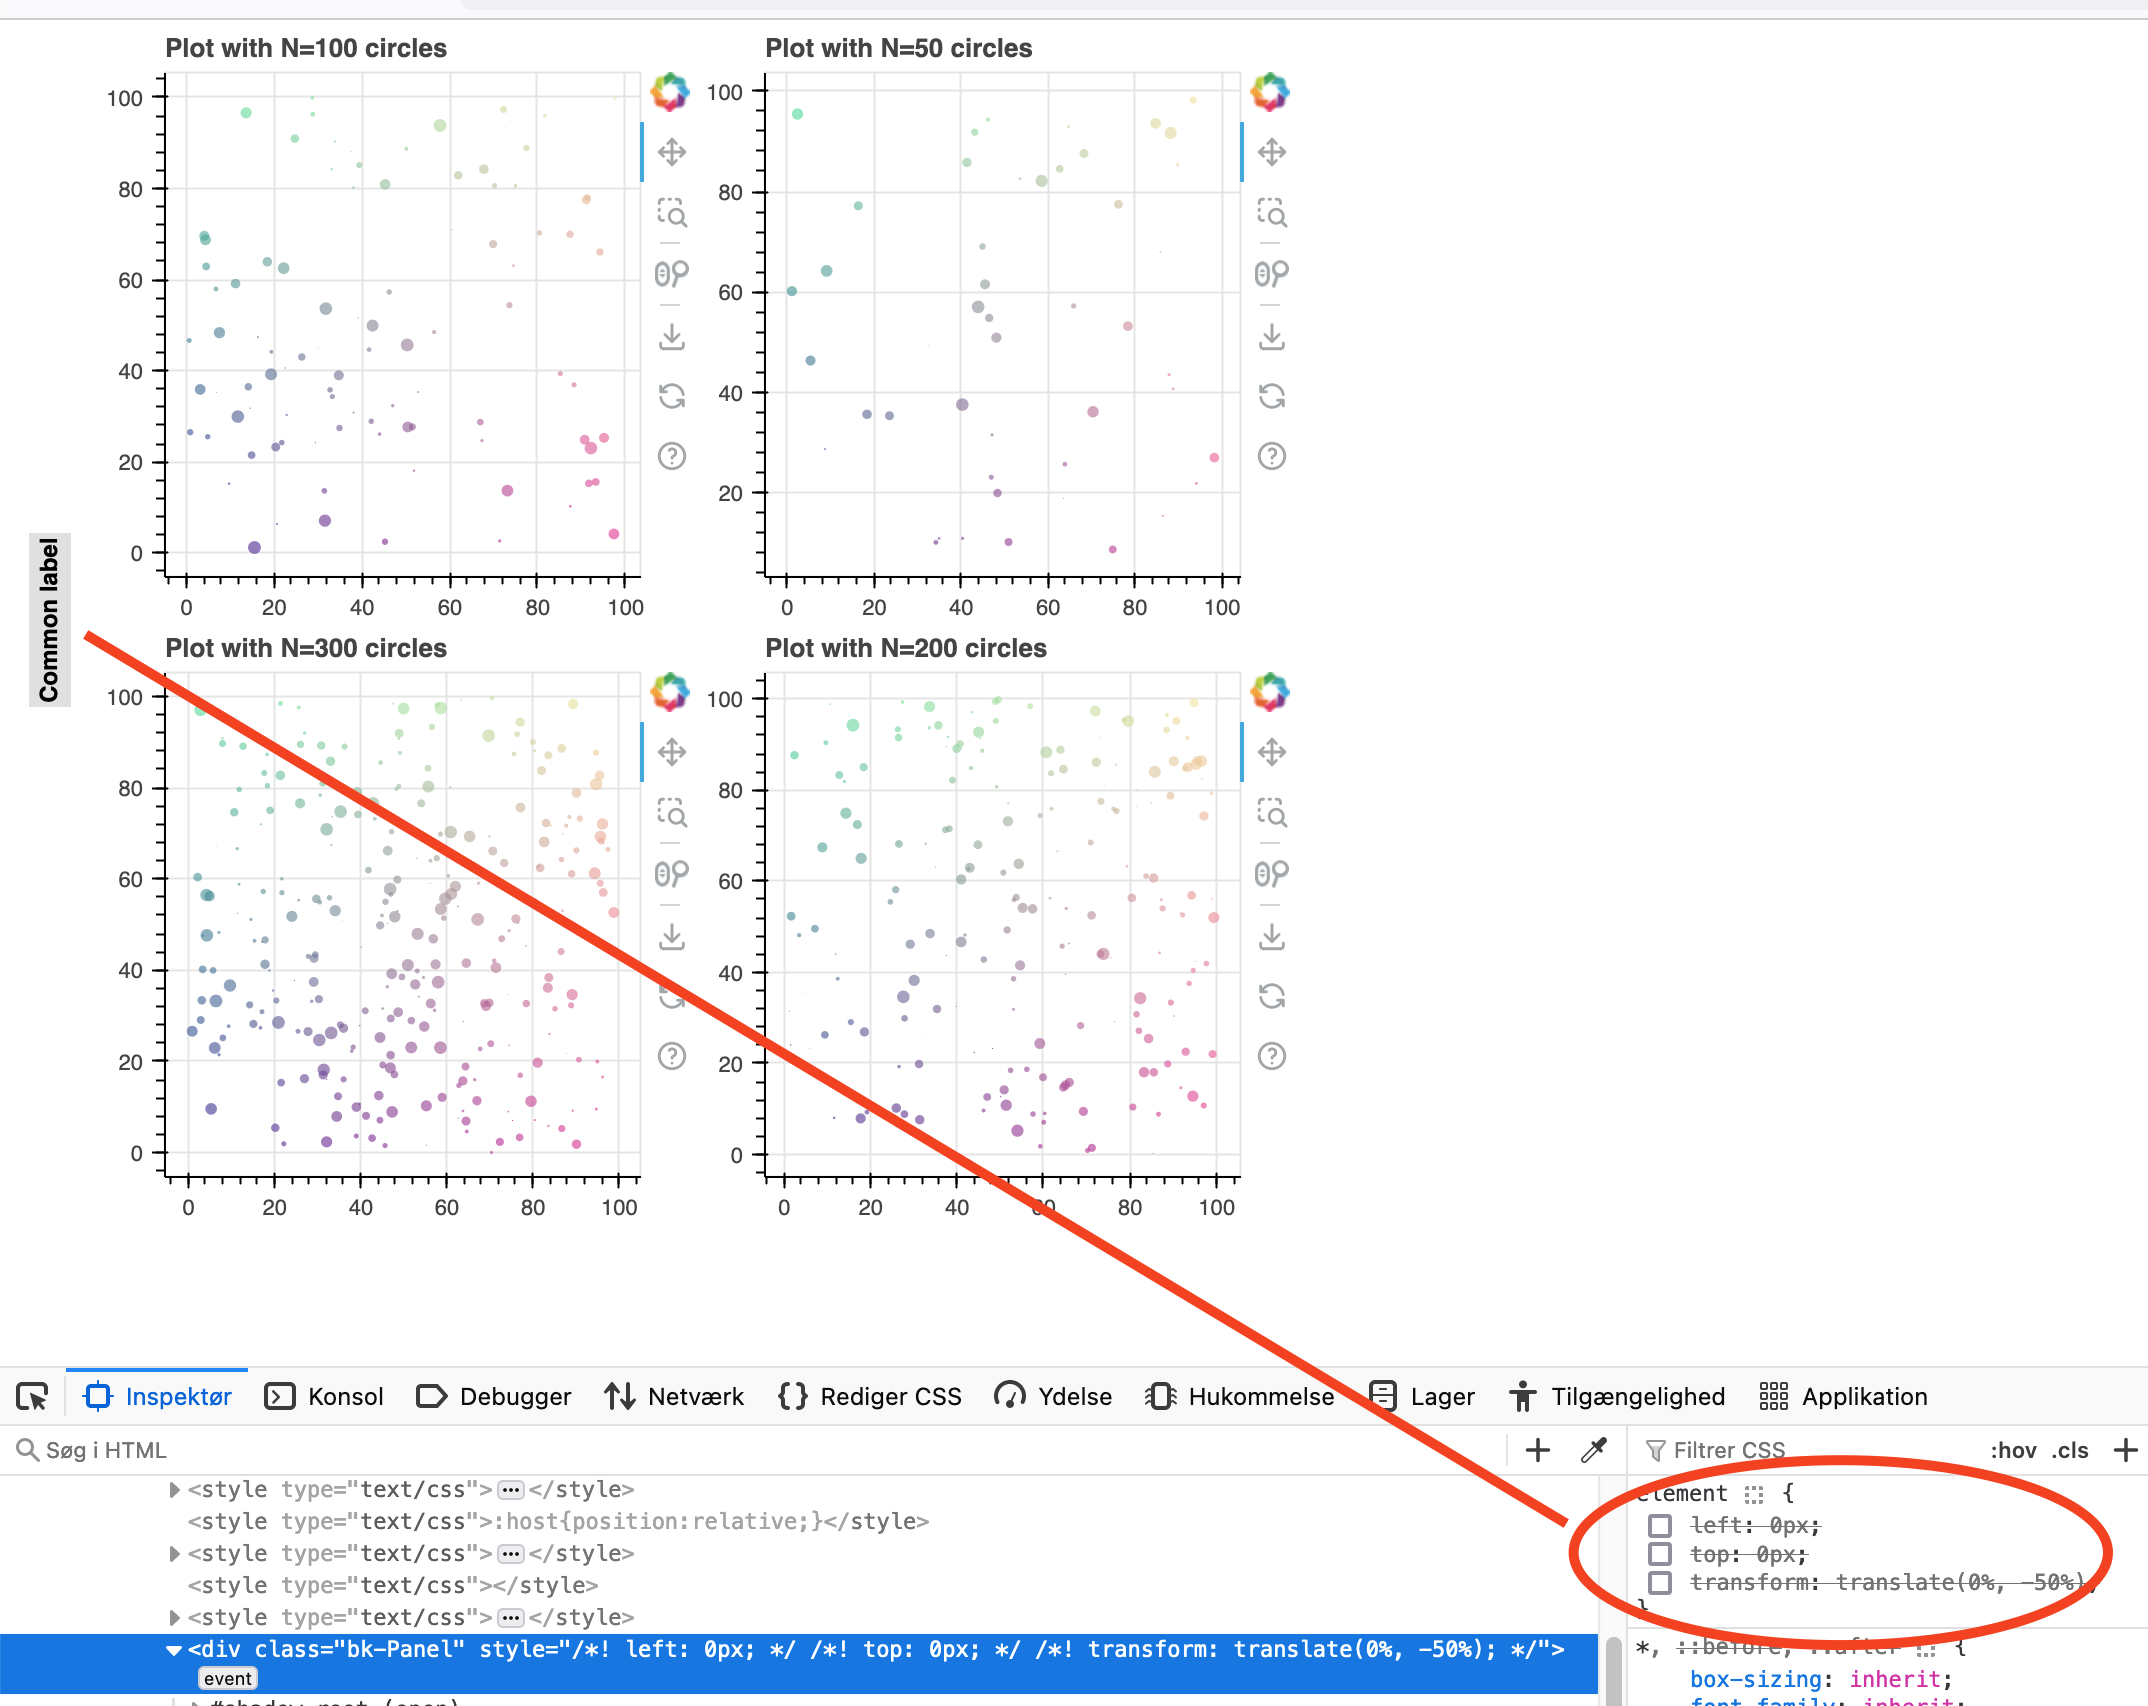
The label is always located in the upper left corner and horizontal. "center_left" does not position the Panel as expected.
If I in the browser developer panel deselect the following styles of div class="bk-Panel" then the label shows up correctly (please see images below).
left: 0px;
top: 0px;
transform: translate(0%, -50%);
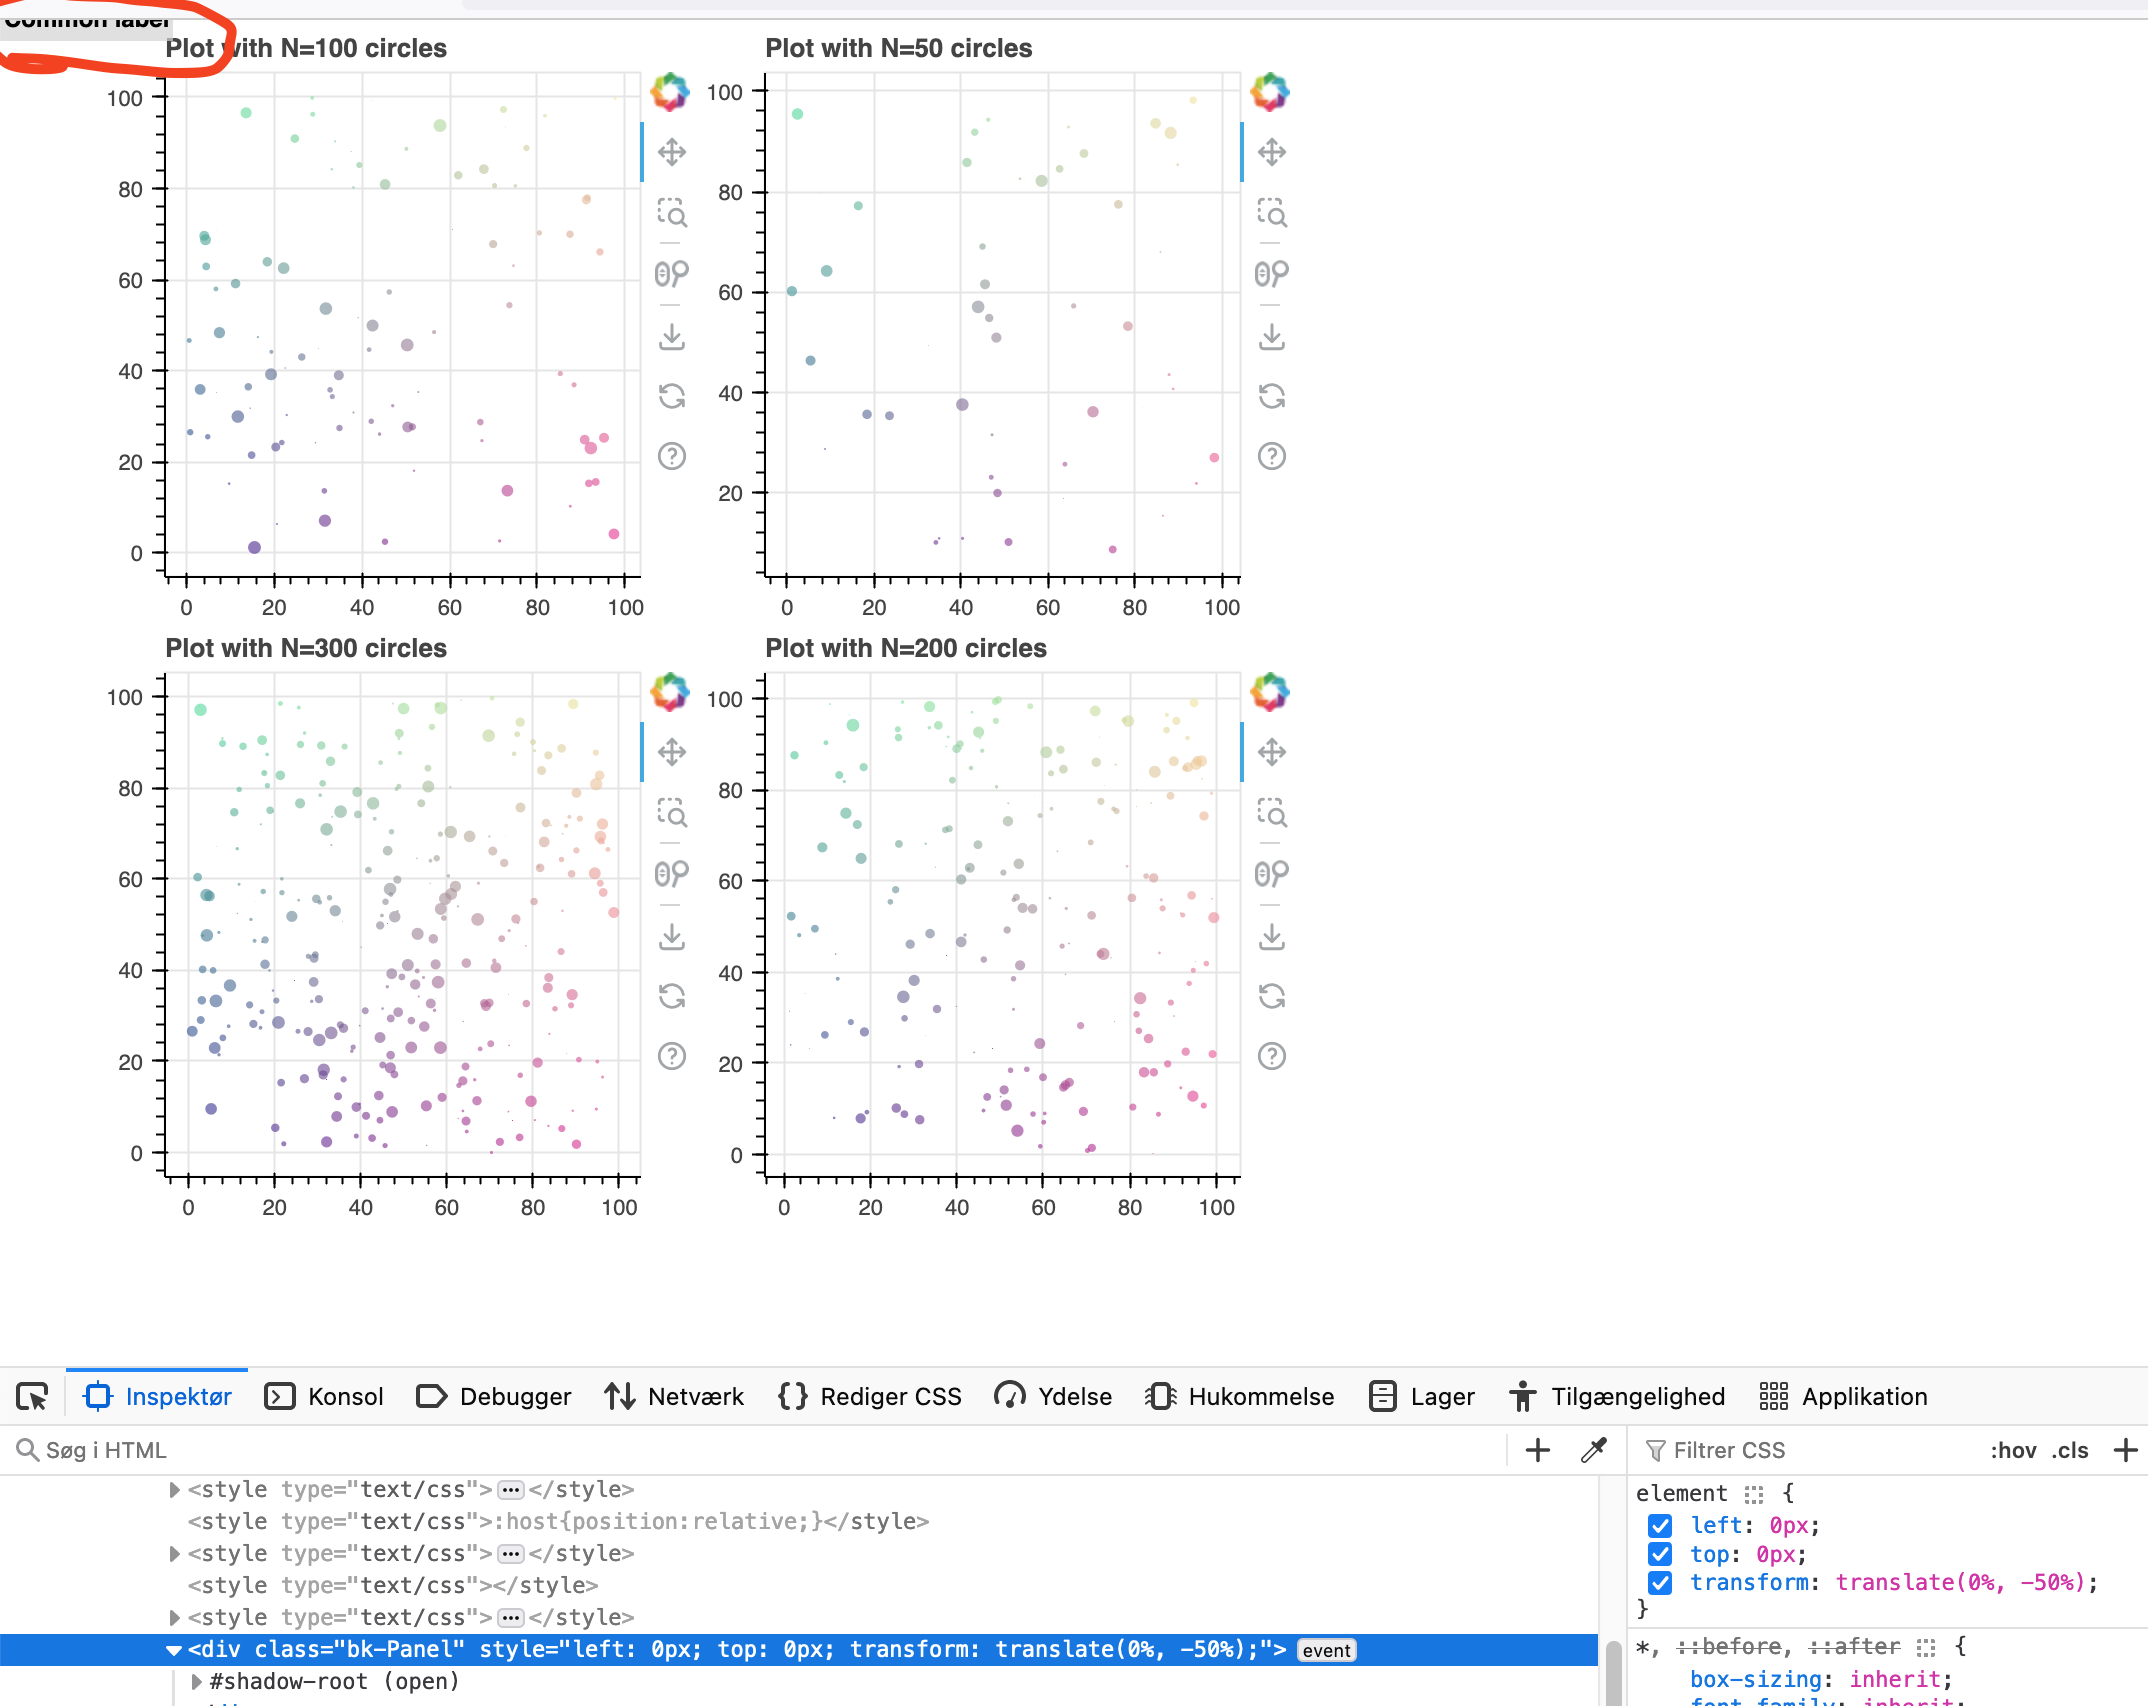
When deselecting bk-Panel element styles:
I am probably doing something wrong with the use of Panel and adding it to the Spacer but my css skills are limited. Can I accomplish what I would like to achieve?
Using Bokeh 3.4.0, Python 3.11.7, Firefox 124.0.1
import numpy as np

from bokeh.io import show
from bokeh.models import Node, Panel, Spacer, InlineStyleSheet
from bokeh.models.dom import HTML
from bokeh.plotting import figure
from bokeh.layouts import grid, row


def plot(N: int):
    x = np.random.random(size=N) * 100
    y = np.random.random(size=N) * 100
    radii = np.random.random(size=N) * 1.5
    colors = np.array(
        [(r, g, 150) for r, g in zip(50+2*x, 30+2*y)],
        dtype="uint8"
        )

    p = figure(
        width = 300,
        height = 300,
        title=f"Plot with N={N} circles"
        )
    p.circle(
        x = x,
        y = y,
        radius=radii,
        fill_color=colors,
        fill_alpha=0.6,
        line_color=None
        )

    return p

def vertical_label(p, node_target, anchor):
    label = Panel(
        position=Node(target=node_target, symbol=anchor),
        anchor=anchor,
        stylesheets=["""
    :host {
      padding: 2px;
      background-color: rgba(211, 211, 211, 0.7);
      font-size: 12px;
      white-space: nowrap;
      overflow: hidden;
      text-overflow: ellipsis;
      transform: rotate(270deg);
      z-index: 9;
    }
    """],
        elements=[
            HTML("<b>Common label</b>"),
        ],
    )
    p.elements.append(label)

plts = []
for p in [100, 50, 300, 200]:
    plts.append(plot(p))

g = grid(children = plts, ncols = 2)

stylesheet = InlineStyleSheet(
    css = '''
    :host(.spacer) {
      display: flex;
      justify-content: center;
      align-items: center;
      }
    '''
)
s = Spacer(
    width = 50,
    css_classes = ['spacer'],
    stylesheets=[stylesheet]
)
vertical_label(s, "parent", "center_left")

layout = row([s, g])

show(layout)