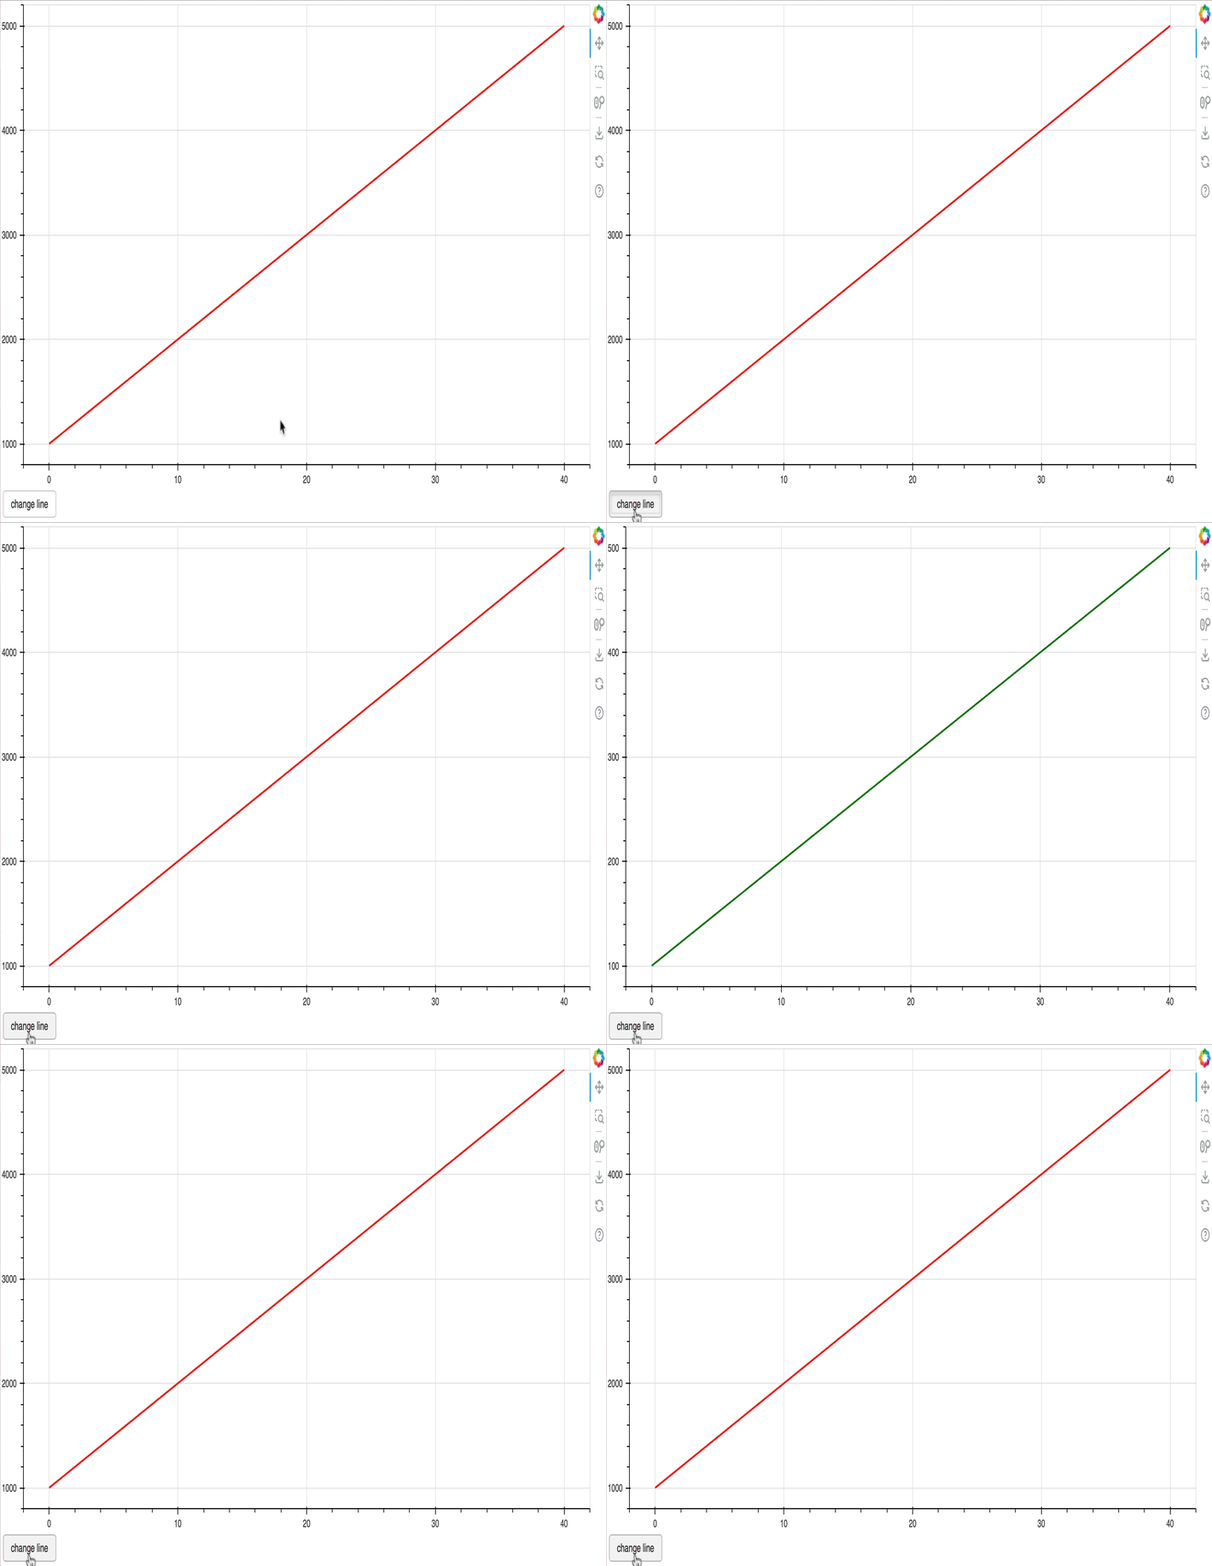
Hi,
I have got a simple plot with 2 multiline renderers. Only one renderer is visible at the time. The y_range of these renders are different so I 'd like to set the y_range of the plot according to the visible renderer.
The y_range computation is done in CustomJS that is trigger when click a button.
The y_range does not change when I change of visible renderer.
I then added another button to trigger another CustomJS. In this CustomJS, the renderers’ visibility is not changed but just the y_range. In this case it is working.
Could you please tell me what I am missing?
See below the bokeh info and minimal reproducible example.
bokeh info:
Python version        :  3.11.10 | packaged by Anaconda, Inc. | (main, Oct  3 2024, 07:22:26) [MSC v.1929 64 bit (AMD64)]
IPython version       :  (not installed)
Tornado version       :  6.4.1
NumPy version         :  1.26.4
Bokeh version         :  3.6.3
BokehJS static path   :  C:\Users\gilles.faure\AppData\Local\miniconda3\envs\EO_py3.11_truck_simulator\Lib\site-packages\bokeh\server\static
node.js version       :  (not installed)
npm version           :  (not installed)
jupyter_bokeh version :  (not installed)
Operating system      :  Windows-10-10.0.22631-SP0
minimal reproducible example:
from bokeh.layouts import layout
from bokeh.models import ColumnDataSource
from bokeh.models import CustomJS
from bokeh.models import Button
from bokeh.models import DataRange1d
from bokeh.plotting import figure
from bokeh.plotting import show


data = {
    'xs': [[0, 10, 20, 30, 40]],
    'ys1': [[1000, 2000, 3000, 4000, 5000]],
    'ys2': [[100, 200, 300, 400, 500]],
}
data_source = ColumnDataSource(data)


p = figure(
    width=2000,
    height=1000,
    background_fill_color="#DCDCDC", background_fill_alpha=0.4,
    y_range=DataRange1d(bounds=None),
)

p.x_range.start = min(data['xs'][0])
p.x_range.end = max(data['xs'][0])
p.y_range.start = min(data['ys1'][0])
p.y_range.start = 0
p.y_range.end = max(data['ys1'][0])


lines_to_displayed = ['ys1', 'ys2']
palette = {'ys1': 'red', 'ys2': 'green'}
renderers = {}
for line_name in lines_to_displayed:
    line_renderer = p.multi_line(
        xs='xs', ys=line_name, source=data_source,
        line_color=palette[line_name],
        line_width=2,
        visible=True if line_name=='ys1' else False,
    )
    renderers[line_name] = line_renderer


change_line_callback = CustomJS(
    args=dict(p=p, renderers=renderers),
    code="""
        console.log('Change line JS')
        console.log('p.y_range.start: ' + p.y_range.start)
        console.log('p.y_range.end: ' + p.y_range.end)
        var max_y = -Infinity;
        var min_y = Infinity;
        Object.entries(renderers).map(entry => {
            let renderer_name = entry[0];
            let renderer = entry[1];
            if (renderer.visible){
                renderer.visible = false
            }
            else {
                renderer.visible = true
                max_y = Math.max(max_y, ...renderer.data_source.data[renderer_name][0])
                min_y = Math.min(min_y, ...renderer.data_source.data[renderer_name][0])
            }
        });
        console.log('min_y: ' + min_y)
        console.log('max_y: ' + max_y)
        p.y_range.start = min_y
        p.y_range.end = max_y
        p.y_range.change.emit()
        p.change.emit()
        console.log('p.y_range.start: ' + p.y_range.start)
        console.log('p.y_range.end: ' + p.y_range.end)
    """
)

change_range_callback = CustomJS(
    args=dict(p=p, renderers=renderers),
    code="""
        console.log('Change range JS')
        console.log('p.y_range.start: ' + p.y_range.start)
        console.log('p.y_range.end: ' + p.y_range.end)
        if (p.y_range.end == 10000) {
            p.y_range.end = 2000
        } else if (p.y_range.end == 2000) {
            p.y_range.end = 10000
        } else {
            p.y_range.end = 10000
        }
        console.log('start: ' + p.y_range.start)
        console.log('end: ' + p.y_range.end)
        p.y_range.change.emit()
        p.change.emit()
    """
)


button1 = Button(label='change line')
button1.js_on_click(change_line_callback)
button2 = Button(label='change range')
button2.js_on_click(change_range_callback)

l = layout([
    [p],
    [button1, button2],
])
show(l)
