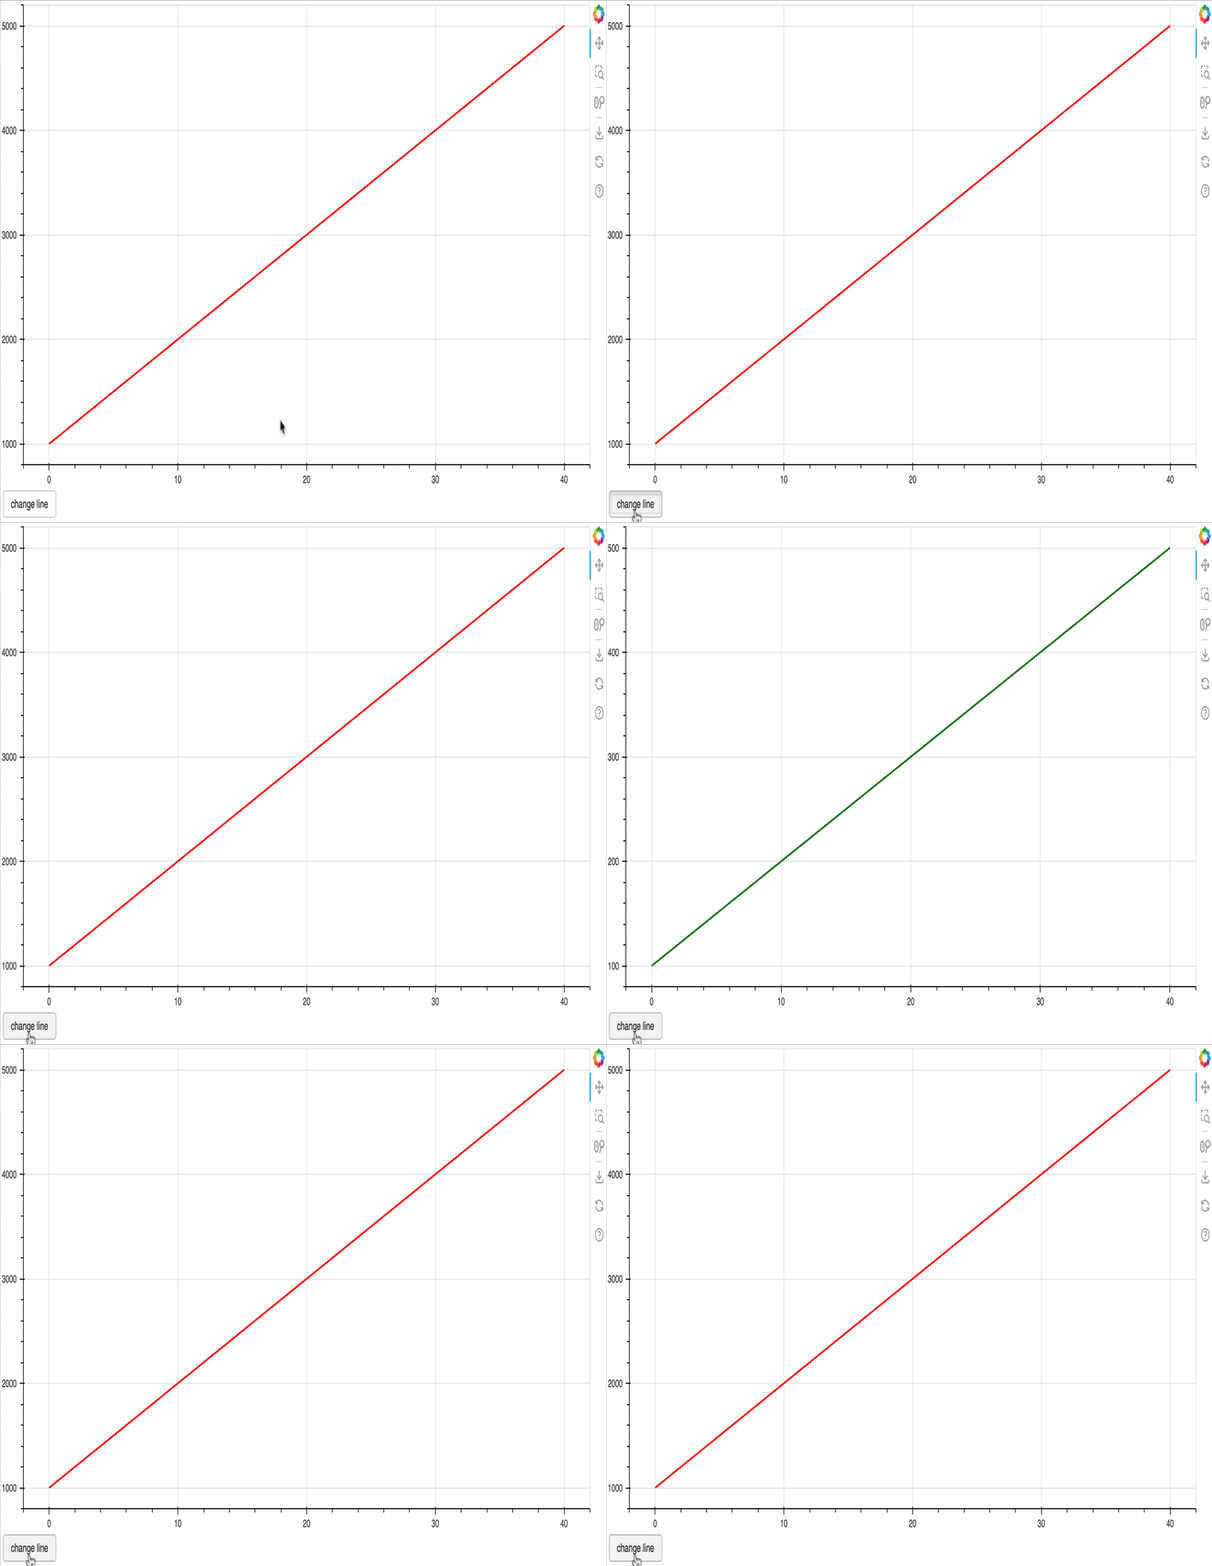
Hi @Gilles the code you have presented seems somewhat overcomplicated relative to what you have described. So, why don’t we start with this much simplified shorter script that (I think) does what you are looking for, to see if it gives you any ideas.
The main observation here is that you should be able to let the default DataRange1d ranges do all the work, since they can trivially be configured to only auto-range based on visible data, rather than all data.
from bokeh.models import ColumnDataSource, CustomJS, Button
from bokeh.plotting import figure, column, show

source = ColumnDataSource({
    'xs': [[0, 10, 20, 30, 40]],
    'ys1': [[1000, 2000, 3000, 4000, 5000]],
    'ys2': [[100, 200, 300, 400, 500]],
})

p = figure(width=1000, height=500)
p.x_range.only_visible = True
p.y_range.only_visible = True

palette = {'ys1': 'red', 'ys2': 'green'}

renderers = {}
for yname in ('ys1', 'ys2'):
    r = p.multi_line(
        xs='xs', ys=yname, source=source,
        line_color=palette[yname], line_width=2,
        visible=(yname=='ys1'),
    )
    renderers[yname] = r

callback = CustomJS(args=dict(p=p, renderers=renderers), code="""
    const {entries} = Bokeh.require("core/util/object")
    for (const [_, renderer] of entries(renderers)) {
        renderer.visible = !renderer.visible
    }
""")

button = Button(label='change line')
button.js_on_click(callback)

show(column(p, button))
