Unable to change x-axis date format

Hello !

I’m trying to create a linechart showing the evolution of occurrences according to trade families over time.

I’m going to run an SQL query on a database to retrieve the results.

Don’t worry about the SQL query: if I only have the month of June, the linechart won’t be displayed, so I’ve added fictitious data.

The date column extracted from my SQL query is in ‘YYYY-MM-DD’ format. I had first made a daily granularity to test my graph. To make it work, I had to convert the date column with pd.to_datetime()

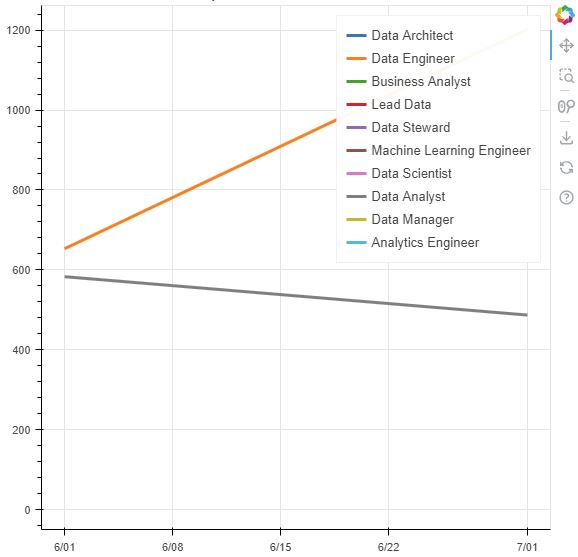
In the case of monthly granularity, I’d like to display only the month and year on the X axis, e.g. “June 2023” only where the data is present, but I can’t manage to display anything other than several dates in the format “06/01, 06/08, 06/15”, and so on.

Do you know how I can do this?

Here’s the actual code, and below a screenshot of the result.

import pandas as pd
import numpy as np
import psycopg2, itertools
from bokeh.plotting import figure, show
from bokeh.palettes import Category10_10 as palette
from bokeh.models import DatetimeTickFormatter

# Database connexion
conn = psycopg2.connect(database="data", user="postgres", password="privatepassword", host="localhost", port="5432")
cursor = conn.cursor()
cursor.execute("""
                (SELECT DATE(DATE_TRUNC('month', date_of_search)), job_search, COUNT(*) 
                FROM rawjobs 
                GROUP BY DATE_TRUNC('month', date_of_search), job_search 
                ORDER BY DATE_TRUNC('month', date_of_search) DESC)
                UNION
                (SELECT DATE('2023-07-01') AS date, 'Data Analyst' AS job_search, '487' AS count)
                UNION
                (SELECT DATE('2023-07-01') AS date, 'Data Engineer' AS job_search, '1202' AS count)
                """)
results = cursor.fetchall()
cursor.close()
conn.close()

# Data preparation
dates = pd.to_datetime([row[0].strftime('%Y-%m-%d') for row in results])
job_searches = [row[1] for row in results]
counts = [row[2] for row in results]

# Chart options
plot = figure(x_axis_type="datetime", title="occurrences evolution over time",
              x_axis_label="date", y_axis_label="occurrences")

# Format the x-axis ticks to display month and year
plot.xaxis[0].formatter = DatetimeTickFormatter(months=["%b"])
plot.xaxis.major_label_orientation = np.pi / 4  # Rotate the labels for better readability

# Trying color palette
colors = itertools.cycle(palette) 

for job_search in list(set(job_searches)):
    job_dates = [date for date, job, count in zip(dates, job_searches, counts) if job == job_search]
    job_counts = [count for date, job, count in zip(dates, job_searches, counts) if job == job_search]
    plot.line(job_dates, job_counts, line_width=3, legend_label=job_search, color=next(colors))

show(plot)

Hello,

I solved my issue. All I had to do was to change this :

plot.xaxis[0].formatter = DatetimeTickFormatter(months=["%b"])

To this :

plot.xaxis[0].formatter = DatetimeTickFormatter(days=["%b"])

But still, it’s not OK because sometimes there are two time the same month displayed. I’ve tried to work differently with fictitious data, but I still have the same problem: it’s impossible to switch from the X axis to the month, whatever the data format (a number to represent the month, month-year, etc.). I’m forced to granularize to the day, which causes a problem of duplicate months.

Here’s the test code:

import pandas as pd
from bokeh.plotting import figure, show
from bokeh.models import DatetimeTickFormatter

df = pd.DataFrame(data={'date': ['2023-07-15', '2023-07-15', '2023-08-15', '2023-08-15', '2023-09-15', '2023-09-15', '2023-10-15', '2023-10-15'],
                   'job_search': ['Data Analyst', 'Data Engineer', 'Data Analyst', 'Data Engineer', 'Data Analyst', 'Data Engineer', 'Data Analyst', 'Data Engineer',],
                    'count': [487, 1202, 422, 1015, 532, 1303, 466, 1402]})

df['date'] = pd.to_datetime(df['date'])
df.sort_values(by=['date'], ascending=False, inplace=True)

# Data Analyst

df_data_analyst = df[df['job_search'] == 'Data Analyst']

# Data Engineer

df_data_engineer = df[df['job_search'] == 'Data Engineer']

p=figure()
p.xaxis[0].formatter = DatetimeTickFormatter(days="%b")
p.line(x=df_data_analyst['date'], y=df_data_analyst['count'], legend_label='Data Analyst', color="blue")
p.line(x=df_data_engineer['date'], y=df_data_engineer['count'], legend_label='Data Engineer', color="red")
show(p)

And here is the result, as you can see there are 2 times September displayed instead of September then October :

Can someone help me about that?

Well, again I have the solution : it’s because I “only” have 4 month of data. With 5 months of data, you can use the plot.xaxis[0].formatter = DatetimeTickFormatter(months=["%b"]) and it will work. If you have less than 5 months of data, it will not work and you’ll have to use plot.xaxis[0].formatter = DatetimeTickFormatter(days=["%b"]) instead, but you’ll see multiple time the same month on the x-axis.

So the “problem” is solved, it’s a Bokeh issue. I have to wayt few months so it will work. :sob:

@GeoffreyLou the tick scales configurations are exclusive to each other. One is chosen based on what the current range extents are, but you can set any or all of them up front once. Unless I am misunderstanding, you seem to want

DatetimeTickFormatter(days=["%b"], months=["%b"]) 

which will use that same format whether the zoom level happens to be days or months.

1 Like

Hello Bryan, it’s exactly what I needed, thank you !

1 Like

This topic was automatically closed 90 days after the last reply. New replies are no longer allowed.