Hello,
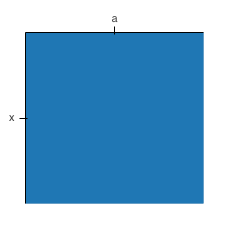
I am trying to plot a matrix with rect glyphs. However, my data varies in length of rows and columns and length of axes labels. I have discovered that the plot aspect ratio is mainly affected by the label size:
from bokeh.plotting import figure
from bokeh.plotting import show


fig = figure(
    x_axis_location="above",
    x_range=["a"],
    y_range=["x"],
    toolbar_location=None,
)

fig.rect(
    'x',
    'y',
    1.0,
    1.0,
    source={"x": [0.5], "y": [0.5]},
)

fig.plot_width = 200
fig.plot_height = 200

show(fig)
Which produces a square of aspect ratio 1:
However, if I change an axis label length to y_range=["xyz ijk lmn uvw"], the I get a distorted square:
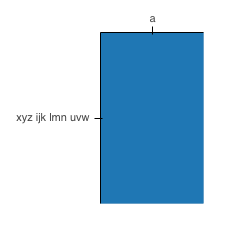
even if I set fig.aspect_ratio = 1.0.
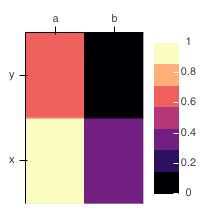
Another frustrating case is when I include a colorbar because it also produces a distorted (i.e. not square) plot:
from bokeh import palettes
from bokeh.models import LinearColorMapper, ColorBar
from bokeh.plotting import figure
from bokeh.plotting import show
from bokeh.transform import transform


fig = figure(
    x_axis_location="above",
    x_range=["a", "b"],
    y_range=["x", "y"],
    toolbar_location=None,
)

colormapper = LinearColorMapper(palette=palettes.magma(7))

fig.rect(
    'x',
    'y',
    1.0,
    1.0,
    source={
        "x": [0.5, 0.5, 1.5, 1.5],
        "y": [0.5, 1.5, 0.5, 1.5],
        "c": [1.0, 0.6, 0.3, 0.0],
    },
    color=transform("c", colormapper),
)

color_bar = ColorBar(
    color_mapper=colormapper,
    location=(0, 0),
)

fig.plot_width = 200
fig.plot_height = 200
fig.aspect_ratio = 1

fig.add_layout(color_bar, 'right')
Futhermore, the inner_width and inner_height attributes of fig are set to None and are read only.
Is there a way of ensuring the aspect ratio is respected, regardless of the axis label sizes or presence of a colorbar?
I’m using Bokeh 2.2.3 on python 3.8.