image_url can show image if it is numerical x & y; below code will work:
xPos = np.random.randint(1,21,5).tolist()
yPos = np.random.randint(1,21,5).tolist()
p = figure()
p.image_url( url=src['image'], x=xPos, y=yPos, w=30, h=30, anchor="center")
However, below code won’t show the image:
xRange = Range1d(pd.to_datetime('2018-02-12 12:00:00'), pd.to_datetime('2018-02-12 16:59:59'))
yRange = list(src.created_by.unique())

p = figure(title=plotTitle,
            x_range=xRange, y_range=yRange, x_axis_type="datetime")
p.image_url( url='image',
             x='created_on', y='created_by', w=30, h=30, anchor="center",source=source)
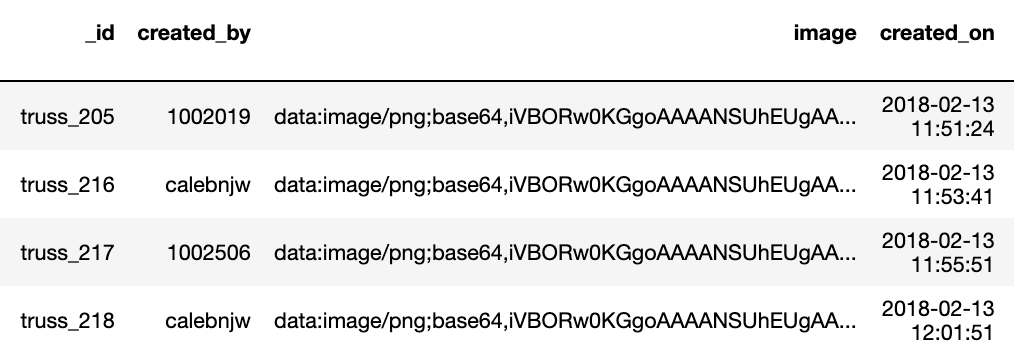
Below is my dataframe (src)
Any idea how to make it render the image for datetime / categorical axis? Thanks!
