Unable to update Y Range Start/End in Custom JS

I am using the following piece of code to dynamically set y_range start and end with a particular checkbox is clicked (CheckBox created via CheckBoxGroup):
y_value is an array which has y axis values for all the line visible at the moment in plot.

Approach 1 :slight_smile:

y_range.setv({"start":y_value[0]*0.95,"end":y_value[y_value.length-1]*1.05});

Approach 2:

value.y_range.start= y_value[0]*0.95;
value.y_range.end = y_value[y_value.length-1]*1.05;

Both of these approaches used to work in Bokeh Version 2.2.3 but i recently updated to version 2.3.0 and none of these are working.
Is this something that was changed in the latest version ?

@devician Either of those seems fine to me, offhand, but there is not enough information to speculate whether there is a bug or some usage issue. What we would need in order to investigate in detail is a Minimal Reproducible Example.

1 Like

@Bryan I have attached html files created by both versions of bokeh 2.2.3 and 2.3.0 named plot_bokeh_v2.2.3.html and plot_bokeh_v2.3.0.html respectively and a test.json data file.
Google Drive link for files

Following is a simplified code of what I am using in my application:

import json
from bokeh.layouts import column, row, gridplot
from bokeh.models import DataRange1d, DatetimeAxis, LinearAxis, Legend, HoverTool, Slider, Span, CustomJS, TableColumn, \
    DataTable, Title, ColumnDataSource, FreehandDrawTool, BoxEditTool,CheckboxGroup, Label, BasicTickFormatter, Div, DatetimeTickFormatter
from bokeh.models.glyphs import Line
from bokeh.palettes import Category20,viridis
from bokeh.plotting import figure, output_file, show, output_notebook

# output_notebook()
output_file('plot_bokeh_v2.2.3.html',mode='inline')

data = json.load(open('test.json'))
legend_text=['test1','test2']
color_mapper = dict(zip(legend_text,Category20[5]))
fig_dict={}
plot_lines={
    'baseline':[],
    'current':[]
}

fig_dict['baseline']=figure(plot_width=600,plot_height=450,title='Baseline',x_axis_type='datetime',y_range=DataRange1d(start=0,end=1000,bounds='auto'),y_axis_label='Response Time',output_backend='svg')
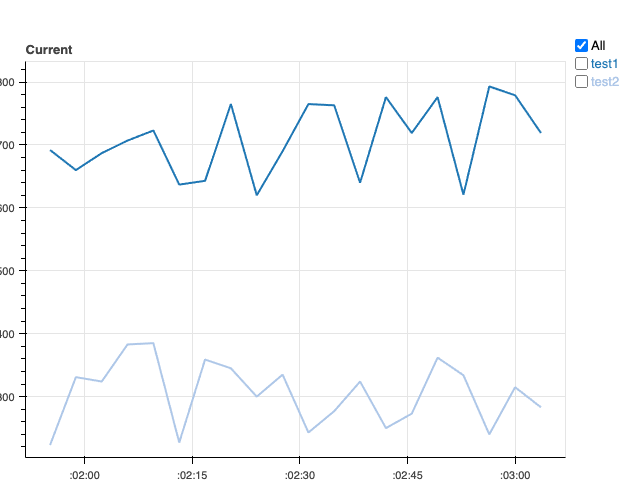
fig_dict['current']=figure(plot_width=600,plot_height=450,title='Current',x_axis_type='datetime',y_range=fig_dict.get('baseline').y_range,y_axis_label='Response Time',output_backend='svg')

# creating two line in each figure 
# figure: baseline , Line : test1
timestamps = data.get('baseline').get('test1').get('timestamp')
response   = data.get('baseline').get('test1').get('responsetime')
color=color_mapper.get('test1')

plot_lines.get('baseline').append( fig_dict.get('baseline').line(x=timestamps,y=response, name='test1', line_width=2, color=color) )

# figure: baseline , Line : test2
timestamps = data.get('baseline').get('test2').get('timestamp')
response   = data.get('baseline').get('test2').get('responsetime')
color=color_mapper.get('test2')

plot_lines.get('baseline').append( fig_dict.get('baseline').line(x=timestamps,y=response, name='test2', line_width=2, color=color) )

# figure: current , Line : test1
timestamps = data.get('current').get('test1').get('timestamp')
response   = data.get('current').get('test1').get('responsetime')
color=color_mapper.get('test1')

plot_lines.get('current').append( fig_dict.get('current').line(x=timestamps,y=response, name='test1', line_width=2, color=color) )

# figure: current , Line : test2
timestamps = data.get('current').get('test2').get('timestamp')
response   = data.get('current').get('test2').get('responsetime')
color=color_mapper.get('test2')

plot_lines.get('current').append( fig_dict.get('current').line(x=timestamps,y=response, name='test2', line_width=2, color=color) )
# created checkbox group to act as legends for the two plots
checkbox_group = CheckboxGroup(labels=['All']+legend_text, active=[0], height=450,width =300)
callback_r = CustomJS(args=dict(plot_lines=plot_lines,checkbox_group=checkbox_group,fig_dict=fig_dict),code="""
    for (const [key, value] of Object.entries(plot_lines)) {
    value.forEach(line =>{line.visible = false;})
}

if (checkbox_group.active.includes(0)) {
    for (const [key, value] of Object.entries(plot_lines)) {
        value.forEach(line =>{line.visible = true;})
    }
} else{
    for (var i = 0; i < checkbox_group.active.length ; i++) {
        var label_index = checkbox_group.active[i];
        var label_name = checkbox_group.labels[label_index];

        for (const [key, value] of Object.entries(plot_lines)) {
            
            value.forEach(line =>{
            if(line.name.localeCompare(label_name) === 0 ){ line.visible = true;} })
        }
    
    }
}
 var y_value=[];
 for (const [key, value] of Object.entries(plot_lines)) {          
             value.forEach(line =>{
                 //console.log(line.visible,line.data_source.data.y);
                 if (line.visible == true){
                     y_value.push.apply(y_value, line.data_source.data.y);
                     }          
             })          
         }
         y_value.sort((a, b) => a - b);
         
         for(const [key,value] of Object.entries(fig_dict)){
             value.y_range.setv({"start":y_value[0]*0.95,"end":y_value[y_value.length-1]*1.05});
             
         }
""")
checkbox_group.js_on_change("active", callback_r)
plot = gridplot([[*fig_dict.values(),checkbox_group]],merge_tools=True)
show(plot)

Please look at html file created from 2.2.3 version and select one checkbox at a time you will get the fell of what i am trying to achieve and that it was working it bokeh version 2.2.3 but somehow its breaking down in the latest version of bokeh 2.3.0.

Let me know if there is a better way to accomplish this task

This code seems really complicated for what seems intended just by using the original version. Before spending time digging in to 100 lines of code, first question: Why are you not simply using the default auto-ranging DataRange1d? As of recent versions you can set the only_visible property. Then it seems all that you need to do in the callback is have a handful of lines to manage the line visibility based on the checkboxes.

@devician why don’t we start from the other direction and build up something from a very simple example. Here is a much simpler script that seems to do what your original version does:

from bokeh.layouts import row
from bokeh.models import CheckboxGroup, CustomJS
from bokeh.plotting import figure, show

p1 = figure(width=300, height=300)
p1.y_range.only_visible = True

t11 = p1.line([1,2,3,4], [2,3,2,3])
t12 = p1.line([1,2,3,4], [4,5,4,5])

p2 = figure(width=300, height=300)
p2.y_range = p1.y_range

t21 = p2.line([1,2,3,4], [1,2,1,2])
t22 = p2.line([1,2,3,4], [5,6,5,6])

checks = CheckboxGroup(labels=['All', 'test1', 'test2'], active=[0])

cb = CustomJS(args=dict(checks=checks, t1s=[t11, t21], t2s=[t12, t22]), code="""
  if (checks.active.includes(0)) {
    for (const t of t1s.concat(t2s)) {t.visible = true}
  } else {
    for (const t of t1s) {t.visible = checks.active.includes(1)}
    for (const t of t2s) {t.visible = checks.active.includes(2)}
  }
""")

checks.js_on_change("active", cb)

show(row(p1, p2, checks))

Beyond that, if you really do want to manage range start/end values manually, I’d recommend doing it this way, which I also tested to work:

cb = CustomJS(args=dict(checks=checks, p1=p1, t1s=[t11, t21], t2s=[t12, t22]), code="""
    if (checks.active.includes(0)) {
        for (const t of t1s.concat(t2s)) {t.visible = true}

        // update the y-range start and end manually
        p1.y_range.start = -10
        p1.y_range.end = 30
    } else {
        for (const t of t1s) {t.visible = checks.active.includes(1)}
        for (const t of t2s) {t.visible = checks.active.includes(2)}
    }
""")

In general, it’s very unusual to use setv, common practice is simply to set property values directly as above.

If you find you things aren’t working still, I would say the next step for debugging is to start adding console.log statements inside the CustomJS to check the actual program state and validate that it matches your expectations. You can also add debugger statements inside the callbacks to stop and single-step through the code. You will want to set the environment variable BOKEH_MINIFIED=no to make sure the browser has un-minified code to step through. Lastly of course, for debugging it is always advised to strip down the code to the bare minimum and remove any extraneous or confounding codepaths.

Otherwise, it would be helpful if you can explain what you are trying to accomplish in plain words, so we can start from a clean slate without preconceptions about an implementation.

@mateusz that said I think there is a buggy interaction with explicit setting start/end and only_visible. Consider this version:

cb = CustomJS(args=dict(checks=checks, p1=p1, t1s=[t11, t21], t2s=[t12, t22]), code="""
    if (checks.active.includes(0)) {
        for (const t of t1s.concat(t2s)) {t.visible = true}
        p1.y_range.start = -10
        p1.y_range.end = 30
    } else {
        for (const t of t1s) {t.visible = checks.active.includes(1)}
        for (const t of t2s) {t.visible = checks.active.includes(2)}
        p1.y_range.start = -20
        p1.y_range.end = 50
    }
    console.log(p1.y_range.start, p1.y_range.end)
""")

If you tick unselect all the boxes then tick “All” on and off then the plot comes back with auto-range values even though start/end were set manually (and should therefore always override auto-ranging).

@devician last bit of advice: if you do want to manually manage start/end, then explicity don’t use a DataRange1d. Use the much, much simpler Range1d instead. DataRanges are one of the most complicated things in all of bokeh and have to handle auto-ranging, manual overrides, streaming data following, hard bounds, glyph visibility and several other things all in one place. If you are managing things manually then you shoudl avoid all that complexity and just use the dumb Range1d which only expects to be set manually.

1 Like

@Bryan Thanks for solution, I am using only_visible in bokeh version 2.3.0, but i need to restrict the start and end to 0 and a max (I calculate dynamically), with only_visible if we pan up or down we can go beyond these limits essentially like an infinite pan in either direction.
As you suggested i will try using Range1d :ok_hand:

Can you also suggest me a way to color individual checkbox in a CheckboxGroup, basically i want each check box to have same color as the line on plot it will be interacting with as in checkbox with label test1 should have the same color as line t11 and t21 as in the figure below.

image

PS: I have added colors here by editing the generated html file.

I just tested the Range1d works for my use case, Thanks for the help @Bryan.

1 Like

There is no API currently in Bokeh to control this. The only option would be to target the CSS manually by adding stylesheets to whatever HTLML you are embedding the Bokeh output into.

@Bryan Can this be a new feature the bokeh team can add? or is it something too complicated to accomplish in bokeh?

@devician You can certainly make a GitHub Issue to request it. I don’t think it is expecially complicated, but there are already 600+ existing open issues, so it’s a matter of limited resources and prioritization. I can’t speculate when anyone on the core team might look at it.