Understanding How to Use `image()` and Its `dw` / `dh` / dw_units`, `dh_units` Parameters

My objective is to display an image in a 1:1 manner on the screen.
Namely each element in the matrix is exactly a single pixel on the screen.

I could achieve it, but something is strange.
I used the basic image example in documentation and altered it a little:

import numpy as np
from bokeh.plotting import figure, show

x = np.linspace(0, 10, 300)
y = np.linspace(0, 10, 300)
xx, yy = np.meshgrid(x, y)
d = np.sin(xx) * np.cos(yy)

p = figure(tools = "hover", width=600, height=600, x_range = (0, 300), y_range = (0, 300))

p.image(image=[d], x=0, y=0, dw=300, dh=300, dw_units = 'screen', dh_units = 'screen', palette="Sunset11", level="image")
p.grid.grid_line_width = 0.5

show(p)

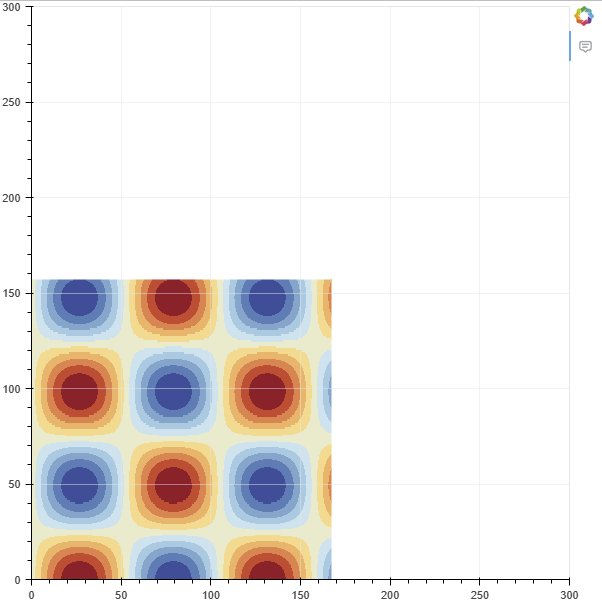
The result I get is:

Which is perfect, the image spans exactly 300x300 pixels on the screen (Verified it in Image Editing application).

What I don’t get is the axis coordinates.
Why don’t they fit the image itself?
I’d expect the image to lay on the range (0, 300)x(0, 300).

How can I align the axis and the pixels?

1 Like

There’s a few things going on. First, a range has nothing to do with pixels. A range is simply a stated numerical span to cover the entire distance of the axis, whatever that is. In this case you have set a plot canvas width of 600px, so you are asking for a range from 0 to 300 over a distance of of 600 pixels, so that’s clearly not a 1-1 match. If you wanted the axis to “match up” with pixels of the image, you’d need to specify a range of, say, (0, 600), and then the image would occupy a quarter of the stated range.

Except that won’t be right either, because the plot canvas dimensions are inclusive of the space occupied by the axes and their labels, etc. so those would need to be subtracted out. In that case that’s probably about ~40px so you’d rally need to specify a range to cover just the size of that subregion spanned by the exes frame, say (0, 560).

Unfortunately, the exact information is not actually available from Python. Being a tool for interactive datavis in browsers, all the actual work, including computing the space needed to occupy the axes, is computed in JavaScript, in the browser, only after all the Python code has finished and exited.

I won’t say this task is impossible in Bokeh. There are things you can do like setting the axes min_border properties to ensure they never occupy less than that space and then also make sure your axis tick labels are formatted or oriented to never need more than that space. Then you could (fairly) reliably compute the pixel size of the interior frame regions yourself. But it’s pretty finicky and there’s still probably other things that have to be dealt (e.g. titles and toolbars). I think there are some relevant topics on Stack Overflow over the years.

TLDR; This is not a great use-case for Bokeh. Bokeh is primarily geared for interactivity like panning and zooming, i.e., all the cases where the image does not stay pixel matched. If it is a hard requirement, there may be other tools to consider that would be better suited.

It does occur to me that it would probably not be too hard to add a readonly AxisScreenRange that simply reports the start and end of the internal axis frames, whatever they are at any moment. They would not be settable, since setting would be tantamount to adjusting the layout, and layout is handled separately. If that sounds useful, please feel free to open a GitHub Issue to propose it for new development.
2 Likes

@Bryan , Appreciate your answer.

Few remarks with your permission:

  1. Is there a mode where instead of defining the actual axis it computed automatically?
    After all, what I ma after is just the numbers will match pixels. So maybe form Python there is a way just to ask for 1:1 in the values and labels of the pixels?
    Then the actual pixel will be whatever the calculation brings and the coordinates of the image will be on (0, 300). Maybe like auto mode for images? Are 1:1 mode?
  2. There are many use cases when analyzing signals that you want no interpolation and no “made up” information. But being able to watch the exact values of the signal. For instance it happens in each line plot. Why not image based plot?
  3. Actually Bokeh was pixel perfect with the image. Something very hard to achieve in other frameworks. So it might be an advantage needs some small refinement? If we add Nearest Neighbor interpolation on zoom it will be suitable for medical and other scientific work with Bokeh.
  4. I am not sure I understood what should I describe in the issue.

Bokeh is amazing, you can see my enthusiasm about it when it was available in Julia.
It was the first thing I saw with the smoothness of MATLAB’s plotting system.
Though there is some struggle there :-).

No, this is exactly what I proposed making an issue for future development for.

There are many use cases when analyzing signals that you want no interpolation

If you use screen units, and set the dimensions to match the image dimensions, there is no interpolation (because the sizes match – see below). The issue is getting an axis that matches the pixels, and the reason that does not exists is that there has never been much demand for it (another good reason to make that issue, to signal interest).

If we add Nearest Neighbor interpolation on zoom it will be suitable for medical and other scientific work with Bokeh.

AFAIK Bokeh already uses the HTML canvas default, which is nearest-neighbor. This will come into play when the dimensions are not the same (some kind of interpolation or scaling is unavoidable in that case).

I am not sure I understood what should I describe in the issue.

I’d say describe your need for an axis that reports pixel distances. It’s always possible to for us ask and answer questions and clarify use-cases in the issue. Just having some issue is the most important first step to getting anything done.

1 Like

I don’t think it is likely that that could be supported, since canvas layout is complicated with many intersecting considerations. But as always, a GitHub development discussion would be a place to propose speculative feature development in any actual detail.

1 Like

This topic was automatically closed 90 days after the last reply. New replies are no longer allowed.