Hi,
From the below code, I’m trying to update the plot dynamically by selecting x-axis and y-axis. When the button is clicked, if the selected column is object (category), then categorical values are plotted and their corresponding values are given as major label overrides. If the selected column is int/float, then axis ticker is set.
from bokeh.io import output_file, show
from bokeh.models.widgets import RangeSlider
from bokeh.models import NumeralTickFormatter
from bokeh.plotting import figure, ColumnDataSource
from bokeh.io import curdoc
from bokeh.models.widgets import Select, Button
from bokeh.layouts import layout, widgetbox, column, row

from math import pi

import numpy as np
import pandas as pd

df = pd.read_csv('https://gist.githubusercontent.com/samirak93/4ec01d6b7d0cda8efedfa9192a7256f4/raw/98b1f86879b849d7cabd6920cbb779a0d91b6b80/CENSUS_INCOME.csv')
x_scat, y_scat = [], []
source_scatter = ColumnDataSource(data=dict(x=x_scat, y=y_scat))
plot_scatter = figure(title="Scatter Plot", plot_height=600, plot_width=800,
                                   tools=['pan,box_zoom,reset'])
plot_scatter.scatter(x='x', y='y', size=10, line_color="white", alpha=0.6,
                                  hover_color='white', hover_alpha=0.5, source=source_scatter)


def create_figure():
    select_x_axis = x_axis.value
    select_y_axis = y_axis.value

    plot_scatter.xaxis.axis_label = select_x_axis
    plot_scatter.yaxis.axis_label = select_y_axis
    ticker_x_dict, ticker_y_dict = {}, {}

    if select_x_axis != "None" and select_y_axis != "None":
        #If column is object, then use major label overrides for each category value
            if str(df[select_x_axis].dtype) == 'object':
                    xs = pd.Categorical(df[select_x_axis]).codes
                    #set ticker
                    plot_scatter.xaxis.ticker = list(set(pd.Categorical(df[select_x_axis]).codes))
                    ticker_x_dict = dict(enumerate(pd.Categorical(df[select_x_axis]).categories))
                    #change ticker text with label overrides
                    plot_scatter.xaxis.major_label_overrides = ticker_x_dict
                    plot_scatter.xaxis.major_label_orientation = pi / 4
            else:
            #if column is int/float, then use same value as ticker
                    xs = df[select_x_axis].values
                    plot_scatter.xaxis.ticker = []
                    plot_scatter.xaxis.ticker = np.linspace(xs.min(),xs.max(), num=5).tolist()

            if str(df[select_y_axis].dtype) == 'object':
                    ys = pd.Categorical(df[select_y_axis]).codes
                    plot_scatter.yaxis.ticker = list(set(pd.Categorical(df[select_y_axis]).codes))
                    ticker_y_dict = dict(enumerate(pd.Categorical(df[select_y_axis]).categories))
                    plot_scatter.yaxis.major_label_overrides = ticker_y_dict
                    plot_scatter.yaxis.major_label_orientation = pi / 4
            else:
                    ys = df[select_y_axis].values
                    plot_scatter.yaxis.ticker = []
                    plot_scatter.yaxis.ticker = np.linspace(ys.min(),ys.max(), num=5).tolist()

            source_scatter.data = dict(x=xs, y=ys)

x_axis = Select(title="X-Axis:", value="None", options=["None"]+ df.columns.tolist())
y_axis = Select(title="Y-Axis:", value="None", options=["None"]+ df.columns.tolist())
button_plot = Button(label="Draw Plot")
button_plot.on_click(create_figure)

curdoc().title = "Axis Label Error"
doc_layout = layout(column(x_axis, y_axis, button_plot, plot_scatter))
curdoc().add_root(doc_layout)
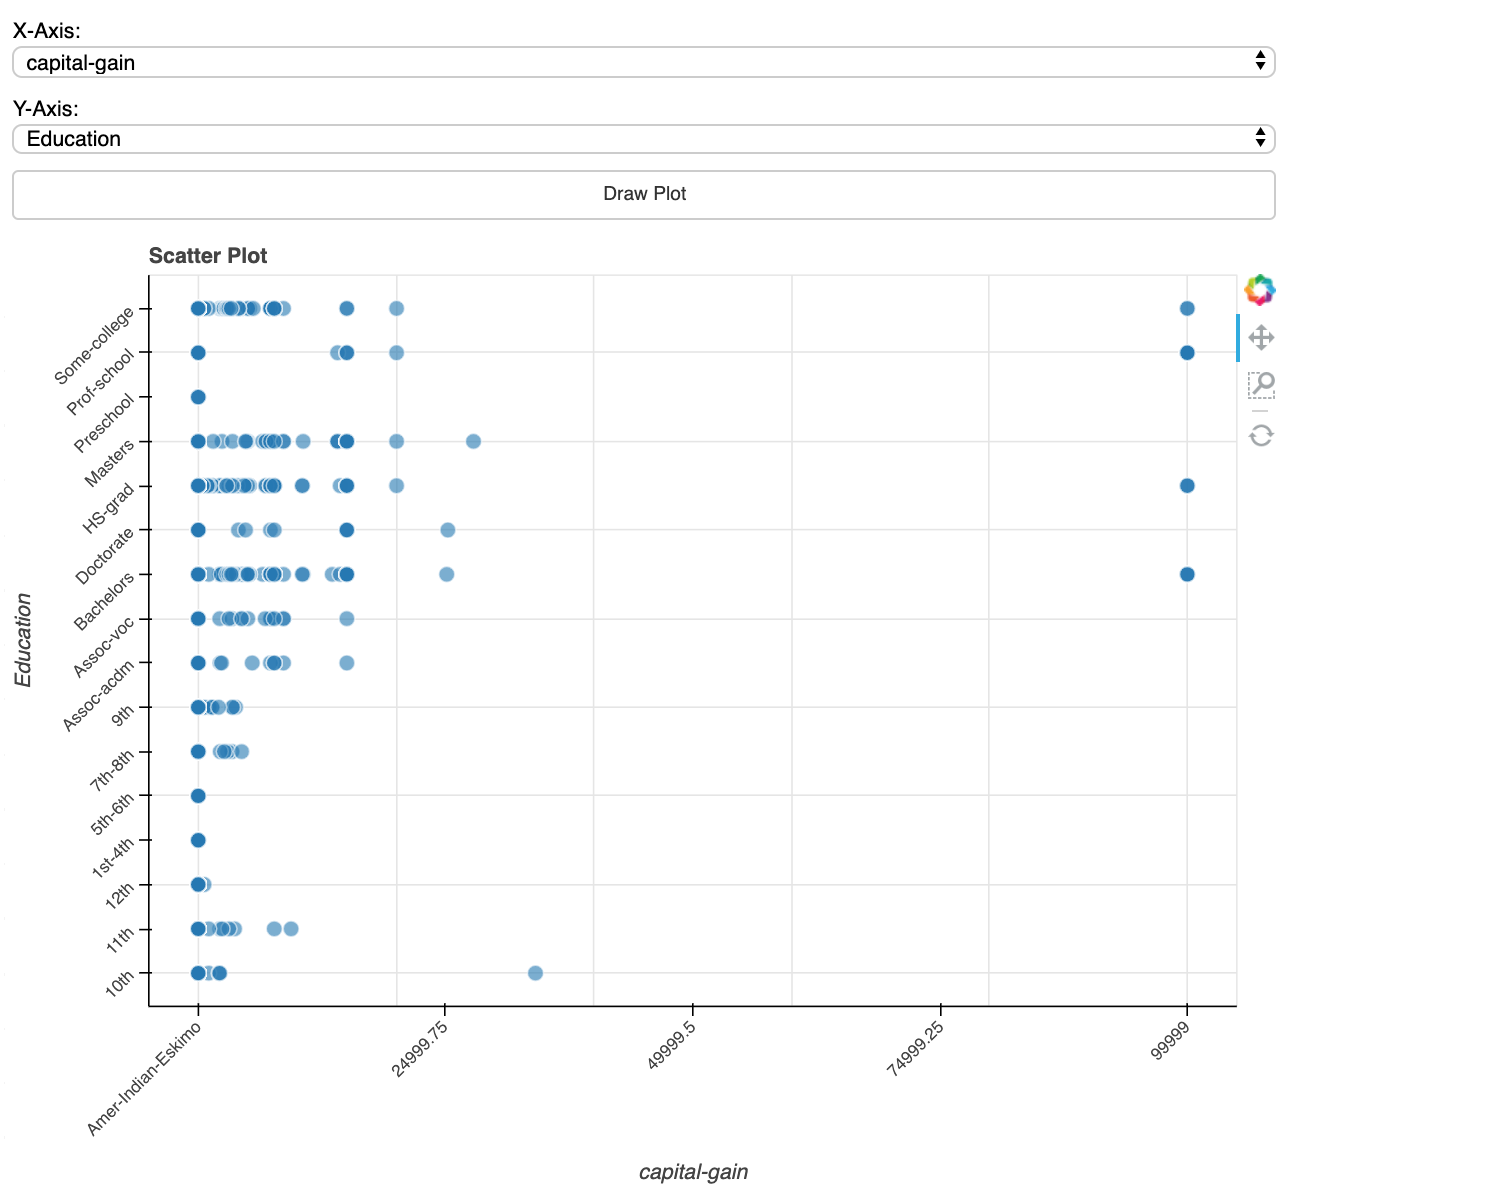
The problem I’m facing is when I change the axis from a int/float value to an object value, the first major tick label stays same (as a categorical value), even if the axis is continuous.
Example: Select Age - Education as x and y axis. Then change age to race so that x-axis gets updated. Now changing x-axis to capital-gain changes all axis labels to their values except the first one as it remains Amer-Indian-Eskimo from previous value.


Any feedback on solving this? or is this a bug? I feel I’m missing something basic.
Thanks.