unexpected initial layout

Dear all,

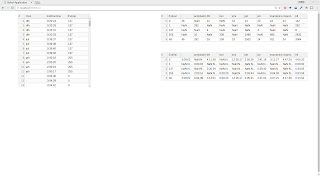
thanks for this marvelous library! I have written a small dashboard to follow some proceses. The dashboard consists of three tables that I render with the layout() function. The problem is that the initial layout has the wrong width making the tables overlap each other.

After moving the browser’s window (with the mouse I mean) the elements re-accommodate and they layout as I expected.
Here is my script

···

from bokeh.layouts import widgetbox, layout
from bokeh.models import ColumnDataSource
from bokeh.models.widgets import DataTable, TableColumn, NumberFormatter
from bokeh.plotting import curdoc
import pandas as pd

df = pd.read_csv(‘job-pipeline.tsv’, sep=’\t’)
source = ColumnDataSource(df)
columns = [
TableColumn(field=“Host”, title=“Host”),
TableColumn(field=“JobRuntime”, title=“JobRuntime”,
formatter=NumberFormatter(format=‘00:00:00’)),
TableColumn(field=“Exitval”, title=“Exitval”),
]
data_table = DataTable(source=source, columns=columns, fit_columns=True,
width=400, height=400)

counts = df.pivot_table(columns=‘Host’, index=‘Exitval’, values=‘JobRuntime’,
aggfunc=len, margins=True)
counts = counts.reset_index()
counts.columns = counts.columns.map(str)
columns2 = [TableColumn(field=val, title=val) for val in counts.columns]
counts = ColumnDataSource(counts)
data_table2 = DataTable(source=counts, columns=columns2, fit_columns=True,
width=800, height=200)

means = df.pivot_table(columns=‘Host’, index=‘Exitval’, values=‘JobRuntime’,
margins=True)
means = means.reset_index()
means.columns = means.columns.map(str)
columns3 = [TableColumn(field=‘Exitval’, title=‘ExitVal’)]
columns3 += [TableColumn(field=val, title=val, formatter=NumberFormatter(format=‘00:00:00’)) for val in means.columns[1:]]
means = ColumnDataSource(means)
data_table3 = DataTable(source=means, columns=columns3, fit_columns=True,
width=800, height=200)

curdoc().add_root(layout([[widgetbox(data_table), widgetbox(data_table2, data_table3)]], width=3000, sizing_mode=‘stretch_both’))


Do any one can explain me why? and how can I get the initial state to be as I expect?

Thanks!

Hi Andres,

  Layout is a new feature and there were a number of tricky corners

making it.

  One of them is widgets. And of all the widgets DataTable is

particularly tricky!

So, my best guess is you need to file a bug…sorry -

  I'm also curious if the initialization is better in fixed and/or

scale_width mode? (Widgets are html elements so their more natural
state is “scale_width”).

Sincerely,

Sarah Bird

···

https://github.com/bokeh/bokeh/issues
On 9/8/16 7:01 PM, Andrés Babino wrote:

Dear all,

      thanks for this marvelous library! I have written a small

dashboard to follow some proceses. The dashboard consists of
three tables that I render with the layout() function. The
problem is that the initial layout has the wrong width making
the tables overlap each other.

      After moving the browser's window (with the mouse I mean)

the elements re-accommodate and they layout as I expected.

Here is my script


from bokeh.layouts import widgetbox, layout

    from bokeh.models import ColumnDataSource

    from bokeh.models.widgets import DataTable, TableColumn,

NumberFormatter

    from bokeh.plotting import curdoc

    import pandas as pd


    df = pd.read_csv('job-pipeline.tsv', sep='\t')

    source = ColumnDataSource(df)

    columns = [

            TableColumn(field="Host", title="Host"),

            TableColumn(field="JobRuntime", title="JobRuntime",

formatter=NumberFormatter(format=‘00:00:00’)),

            TableColumn(field="Exitval", title="Exitval"),

        ]

    data_table = DataTable(source=source, columns=columns,

fit_columns=True,

                           width=400, height=400)


    counts = df.pivot_table(columns='Host', index='Exitval',

values=‘JobRuntime’,

                            aggfunc=len, margins=True)

    counts = counts.reset_index()

    counts.columns = counts.columns.map(str)

    columns2 = [TableColumn(field=val, title=val) for val in

counts.columns]

    counts = ColumnDataSource(counts)

    data_table2 = DataTable(source=counts, columns=columns2,

fit_columns=True,

                            width=800, height=200)


    means = df.pivot_table(columns='Host', index='Exitval',

values=‘JobRuntime’,

                           margins=True)

    means = means.reset_index()

    means.columns = means.columns.map(str)

    columns3 = [TableColumn(field='Exitval', title='ExitVal')]

    columns3 += [TableColumn(field=val, title=val,

formatter=NumberFormatter(format=‘00:00:00’)) for val in
means.columns[1:]]

    means = ColumnDataSource(means)

    data_table3 = DataTable(source=means, columns=columns3,

fit_columns=True,

                            width=800, height=200)


        curdoc().add_root(layout([[widgetbox(data_table),

widgetbox(data_table2, data_table3)]], width=3000,
sizing_mode=‘stretch_both’))


        Do any one can explain me why? and how can I get the

initial state to be as I expect?

Thanks!

  You received this message because you are subscribed to the Google

Groups “Bokeh Discussion - Public” group.

  To unsubscribe from this group and stop receiving emails from it,

send an email to [email protected].

  To post to this group, send email to [email protected].

  To view this discussion on the web visit [https://groups.google.com/a/continuum.io/d/msgid/bokeh/55514ec9-7e3f-47c7-adce-4eacf12a0741%40continuum.io](https://groups.google.com/a/continuum.io/d/msgid/bokeh/55514ec9-7e3f-47c7-adce-4eacf12a0741%40continuum.io?utm_medium=email&utm_source=footer).

  For more options, visit [https://groups.google.com/a/continuum.io/d/optout](https://groups.google.com/a/continuum.io/d/optout).


Sarah Bird
Developer, Bokeh

    [
      ![Continuum Analytics](http://docs.continuum.io/_static/img/ContinuumWordmark.png)
    ](http://continuum.io)

Sarah,

Thank you for your answer. I tried with all scale modes and the result is the same. But I did not get the “and/or”. Do you mean that there are two objects with this property, don’t you? To which ones do you refer to? DataTable, widgetbox, layout?

I have also tried with other layouts functions like row but again funny things happens at beginning. So is not something specifically related to layout, could be a DataTable thing. I don’t know. Any way I will fill the bug.

Thanks again

Bests

···

On Thu, 8 Sep 2016 at 23:37 Sarah Bird - Continuum [email protected] wrote:

Hi Andres,

  Layout is a new feature and there were a number of tricky corners

making it.

  One of them is widgets. And of all the widgets DataTable is

particularly tricky!

  So, my best guess is you need to file a bug....sorry -

https://github.com/bokeh/bokeh/issues

  I'm also curious if the initialization is better in fixed and/or

scale_width mode? (Widgets are html elements so their more natural
state is “scale_width”).

Sincerely,

Sarah Bird

On 9/8/16 7:01 PM, Andrés Babino wrote:

Dear all,

      thanks for this marvelous library! I have written a small

dashboard to follow some proceses. The dashboard consists of
three tables that I render with the layout() function. The
problem is that the initial layout has the wrong width making
the tables overlap each other.

      After moving the browser's window (with the mouse I mean)

the elements re-accommodate and they layout as I expected.

Here is my script


from bokeh.layouts import widgetbox, layout

    from bokeh.models import ColumnDataSource

    from bokeh.models.widgets import DataTable, TableColumn,

NumberFormatter

    from bokeh.plotting import curdoc

    import pandas as pd


    df = pd.read_csv('job-pipeline.tsv', sep='\t')

    source = ColumnDataSource(df)

    columns = [

            TableColumn(field="Host", title="Host"),

            TableColumn(field="JobRuntime", title="JobRuntime",

formatter=NumberFormatter(format=‘00:00:00’)),

            TableColumn(field="Exitval", title="Exitval"),

        ]

    data_table = DataTable(source=source, columns=columns,

fit_columns=True,

                           width=400, height=400)


    counts = df.pivot_table(columns='Host', index='Exitval',

values=‘JobRuntime’,

                            aggfunc=len, margins=True)

    counts = counts.reset_index()

    counts.columns = counts.columns.map(str)

    columns2 = [TableColumn(field=val, title=val) for val in

counts.columns]

    counts = ColumnDataSource(counts)

    data_table2 = DataTable(source=counts, columns=columns2,

fit_columns=True,

                            width=800, height=200)


    means = df.pivot_table(columns='Host', index='Exitval',

values=‘JobRuntime’,

                           margins=True)

    means = means.reset_index()

    means.columns = means.columns.map(str)

    columns3 = [TableColumn(field='Exitval', title='ExitVal')]

    columns3 += [TableColumn(field=val, title=val,

formatter=NumberFormatter(format=‘00:00:00’)) for val in
means.columns[1:]]

    means = ColumnDataSource(means)

    data_table3 = DataTable(source=means, columns=columns3,

fit_columns=True,

                            width=800, height=200)


        curdoc().add_root(layout([[widgetbox(data_table),

widgetbox(data_table2, data_table3)]], width=3000,
sizing_mode=‘stretch_both’))


        Do any one can explain me why? and how can I get the

initial state to be as I expect?

Thanks!

  You received this message because you are subscribed to the Google

Groups “Bokeh Discussion - Public” group.

  To unsubscribe from this group and stop receiving emails from it,

send an email to [email protected].

  To post to this group, send email to [email protected].

  To view this discussion on the web visit [https://groups.google.com/a/continuum.io/d/msgid/bokeh/55514ec9-7e3f-47c7-adce-4eacf12a0741%40continuum.io](https://groups.google.com/a/continuum.io/d/msgid/bokeh/55514ec9-7e3f-47c7-adce-4eacf12a0741%40continuum.io?utm_medium=email&utm_source=footer).

  For more options, visit [https://groups.google.com/a/continuum.io/d/optout](https://groups.google.com/a/continuum.io/d/optout).


Sarah Bird
Developer, Bokeh

    [
      <img alt="Continuum Analytics" src="http://docs.continuum.io/_static/img/ContinuumWordmark.png" style="width:150px;min-height:30px" height="30px" width="150px">
    ](http://continuum.io)

You received this message because you are subscribed to the Google Groups “Bokeh Discussion - Public” group.

To unsubscribe from this group and stop receiving emails from it, send an email to [email protected].

To post to this group, send email to [email protected].

To view this discussion on the web visit https://groups.google.com/a/continuum.io/d/msgid/bokeh/cde2b833-4b77-ca84-4c33-64ef4a3875d1%40continuum.io.

For more options, visit https://groups.google.com/a/continuum.io/d/optout.

But I did not get the “and/or”.

  Sorry I meant 'fixed' and/or 'scale_width' with your code -

meaning that maybe one would work, or maybe they’d both be broken.

  While you're looking into this, I know it's cumbersome, but can

you try manually putting the sizing mode on the DataTable and
widgetbox themselves - you shouldn’t need to - that’s the point of
the layout functions - but we may be missing a nesting thing.

Best,

Bird

···

On 9/9/16 1:05 PM, Andrés Babino wrote:

Sarah,

      Thank you for your answer. I tried with all scale modes and

the result is the same. But I did not get the “and/or”. Do you
mean that there are two objects with this property, don’t you?
To which ones do you refer to? DataTable, widgetbox, layout?

      I have also tried with other layouts functions like row but

again funny things happens at beginning. So is not something
specifically related to layout, could be a DataTable thing. I
don’t know. Any way I will fill the bug.

Thanks again

Bests

      On Thu, 8 Sep 2016 at 23:37 Sarah Bird -

Continuum <[email protected] >
wrote:

Hi Andres,

          Layout is a new feature and there were a number of tricky

corners making it.

          One of them is widgets. And of all the widgets DataTable

is particularly tricky!

So, my best guess is you need to file a bug…sorry - https://github.com/bokeh/bokeh/issues

          I'm also curious if the initialization is better in fixed

and/or scale_width mode? (Widgets are html elements so
their more natural state is “scale_width”).

Sincerely,

Sarah Bird

On 9/8/16 7:01 PM, Andrés Babino wrote:

Dear all,

              thanks for this marvelous library! I have written a

small dashboard to follow some proceses. The dashboard
consists of three tables that I render with the
layout() function. The problem is that the initial
layout has the wrong width making the tables overlap
each other.

              After moving the browser's window (with the mouse I

mean) the elements re-accommodate and they layout as I
expected.

Here is my script


from bokeh.layouts import widgetbox, layout

            from bokeh.models import ColumnDataSource

            from bokeh.models.widgets import DataTable, TableColumn,

NumberFormatter

            from bokeh.plotting import curdoc

            import pandas as pd


            df = pd.read_csv('job-pipeline.tsv', sep='\t')

            source = ColumnDataSource(df)

            columns = [

                    TableColumn(field="Host", title="Host"),

                    TableColumn(field="JobRuntime",

title=“JobRuntime”,

formatter=NumberFormatter(format=‘00:00:00’)),

                    TableColumn(field="Exitval", title="Exitval"),

                ]

            data_table = DataTable(source=source, columns=columns,

fit_columns=True,

                                   width=400, height=400)


            counts = df.pivot_table(columns='Host', index='Exitval',

values=‘JobRuntime’,

                                    aggfunc=len, margins=True)

            counts = counts.reset_index()

            counts.columns = counts.columns.map(str)

            columns2 = [TableColumn(field=val, title=val) for val in

counts.columns]

            counts = ColumnDataSource(counts)

            data_table2 = DataTable(source=counts, columns=columns2,

fit_columns=True,

                                    width=800, height=200)


            means = df.pivot_table(columns='Host', index='Exitval',

values=‘JobRuntime’,

                                   margins=True)

            means = means.reset_index()

            means.columns = means.columns.map(str)

            columns3 = [TableColumn(field='Exitval',

title=‘ExitVal’)]

            columns3 += [TableColumn(field=val, title=val,

formatter=NumberFormatter(format=‘00:00:00’)) for val in
means.columns[1:]]

            means = ColumnDataSource(means)

            data_table3 = DataTable(source=means, columns=columns3,

fit_columns=True,

                                    width=800, height=200)


                curdoc().add_root(layout([[widgetbox(data_table),

widgetbox(data_table2, data_table3)]], width=3000,
sizing_mode=‘stretch_both’))


                Do any one can explain me why? and how can I get

the initial state to be as I expect?

Thanks!

          You received this message because you are subscribed to

the Google Groups “Bokeh Discussion - Public” group.

          To unsubscribe from this group and stop receiving emails

from it, send an email to [email protected].

          To post to this group, send email to [email protected].

          To view this discussion on the web visit [https://groups.google.com/a/continuum.io/d/msgid/bokeh/55514ec9-7e3f-47c7-adce-4eacf12a0741%40continuum.io](https://groups.google.com/a/continuum.io/d/msgid/bokeh/55514ec9-7e3f-47c7-adce-4eacf12a0741%40continuum.io?utm_medium=email&utm_source=footer).

          For more options, visit [https://groups.google.com/a/continuum.io/d/optout](https://groups.google.com/a/continuum.io/d/optout).


Sarah Bird
Developer, Bokeh

            [ ![Continuum Analytics](http://docs.continuum.io/_static/img/ContinuumWordmark.png) ](http://continuum.io)

      You received this message because you are subscribed to the

Google Groups “Bokeh Discussion - Public” group.

      To unsubscribe from this group and stop receiving emails from

it, send an email to [email protected].

      To post to this group, send email to [email protected].

      To view this discussion on the web visit [https://groups.google.com/a/continuum.io/d/msgid/bokeh/cde2b833-4b77-ca84-4c33-64ef4a3875d1%40continuum.io](https://groups.google.com/a/continuum.io/d/msgid/bokeh/cde2b833-4b77-ca84-4c33-64ef4a3875d1%40continuum.io?utm_medium=email&utm_source=footer).

      For more options, visit [https://groups.google.com/a/continuum.io/d/optout](https://groups.google.com/a/continuum.io/d/optout).

  You received this message because you are subscribed to the Google

Groups “Bokeh Discussion - Public” group.

  To unsubscribe from this group and stop receiving emails from it,

send an email to [email protected].

  To post to this group, send email to [email protected].

  To view this discussion on the web visit [https://groups.google.com/a/continuum.io/d/msgid/bokeh/CAMOYv9ESshnOz%3DfOX1hkaATyjx0EBMQAaGQLt6EcYAsjMoMySw%40mail.gmail.com](https://groups.google.com/a/continuum.io/d/msgid/bokeh/CAMOYv9ESshnOz%3DfOX1hkaATyjx0EBMQAaGQLt6EcYAsjMoMySw%40mail.gmail.com?utm_medium=email&utm_source=footer).

  For more options, visit [https://groups.google.com/a/continuum.io/d/optout](https://groups.google.com/a/continuum.io/d/optout).


Sarah Bird
Developer, Bokeh

    [
      ![Continuum Analytics](http://docs.continuum.io/_static/img/ContinuumWordmark.png)
    ](http://continuum.io)

Sarah,
ok, I’ve already done that. I think that I have tried every possible combination with the tree objects–layout, widgetbox and datatable

Any way I’ve filled the bug report on github and I will try to keep looking for a fix, probably by digging deeper into the bokeh.

So if anyone is reading this, the discussion have moved to https://github.com/bokeh/bokeh/issues/5131

Thanks again!

···

On Fri, 9 Sep 2016 at 18:13 Sarah Bird - Continuum [email protected] wrote:

But I did not get the “and/or”.

  Sorry I meant 'fixed' and/or 'scale_width' with your code -

meaning that maybe one would work, or maybe they’d both be broken.

  While you're looking into this, I know it's cumbersome, but can

you try manually putting the sizing mode on the DataTable and
widgetbox themselves - you shouldn’t need to - that’s the point of
the layout functions - but we may be missing a nesting thing.

Best,

Bird

On 9/9/16 1:05 PM, Andrés Babino wrote:

Sarah,

      Thank you for your answer. I tried with all scale modes and

the result is the same. But I did not get the “and/or”. Do you
mean that there are two objects with this property, don’t you?
To which ones do you refer to? DataTable, widgetbox, layout?

      I have also tried with other layouts functions like row but

again funny things happens at beginning. So is not something
specifically related to layout, could be a DataTable thing. I
don’t know. Any way I will fill the bug.

Thanks again

Bests

      On Thu, 8 Sep 2016 at 23:37 Sarah Bird - > > Continuum <[email protected]          > > > wrote:

Hi Andres,

          Layout is a new feature and there were a number of tricky

corners making it.

          One of them is widgets. And of all the widgets DataTable

is particularly tricky!

So, my best guess is you need to file a bug…sorry - https://github.com/bokeh/bokeh/issues

          I'm also curious if the initialization is better in fixed

and/or scale_width mode? (Widgets are html elements so
their more natural state is “scale_width”).

Sincerely,

Sarah Bird

On 9/8/16 7:01 PM, Andrés Babino wrote:

Dear all,

              thanks for this marvelous library! I have written a

small dashboard to follow some proceses. The dashboard
consists of three tables that I render with the
layout() function. The problem is that the initial
layout has the wrong width making the tables overlap
each other.

              After moving the browser's window (with the mouse I

mean) the elements re-accommodate and they layout as I
expected.

Here is my script


from bokeh.layouts import widgetbox, layout

            from bokeh.models import ColumnDataSource

            from bokeh.models.widgets import DataTable, TableColumn,

NumberFormatter

            from bokeh.plotting import curdoc

            import pandas as pd


            df = pd.read_csv('job-pipeline.tsv', sep='\t')

            source = ColumnDataSource(df)

            columns = [

                    TableColumn(field="Host", title="Host"),

                    TableColumn(field="JobRuntime",

title=“JobRuntime”,

formatter=NumberFormatter(format=‘00:00:00’)),

                    TableColumn(field="Exitval", title="Exitval"),

                ]

            data_table = DataTable(source=source, columns=columns,

fit_columns=True,

                                   width=400, height=400)


            counts = df.pivot_table(columns='Host', index='Exitval',

values=‘JobRuntime’,

                                    aggfunc=len, margins=True)

            counts = counts.reset_index()

            counts.columns = counts.columns.map(str)

            columns2 = [TableColumn(field=val, title=val) for val in

counts.columns]

            counts = ColumnDataSource(counts)

            data_table2 = DataTable(source=counts, columns=columns2,

fit_columns=True,

                                    width=800, height=200)


            means = df.pivot_table(columns='Host', index='Exitval',

values=‘JobRuntime’,

                                   margins=True)

            means = means.reset_index()

            means.columns = means.columns.map(str)

            columns3 = [TableColumn(field='Exitval',

title=‘ExitVal’)]

            columns3 += [TableColumn(field=val, title=val,

formatter=NumberFormatter(format=‘00:00:00’)) for val in
means.columns[1:]]

            means = ColumnDataSource(means)

            data_table3 = DataTable(source=means, columns=columns3,

fit_columns=True,

                                    width=800, height=200)


                curdoc().add_root(layout([[widgetbox(data_table),

widgetbox(data_table2, data_table3)]], width=3000,
sizing_mode=‘stretch_both’))


                Do any one can explain me why? and how can I get

the initial state to be as I expect?

Thanks!

          You received this message because you are subscribed to

the Google Groups “Bokeh Discussion - Public” group.

          To unsubscribe from this group and stop receiving emails

from it, send an email to [email protected].

          To post to this group, send email to [email protected].

          To view this discussion on the web visit [https://groups.google.com/a/continuum.io/d/msgid/bokeh/55514ec9-7e3f-47c7-adce-4eacf12a0741%40continuum.io](https://groups.google.com/a/continuum.io/d/msgid/bokeh/55514ec9-7e3f-47c7-adce-4eacf12a0741%40continuum.io?utm_medium=email&utm_source=footer).

          For more options, visit [https://groups.google.com/a/continuum.io/d/optout](https://groups.google.com/a/continuum.io/d/optout).


Sarah Bird
Developer, Bokeh

            [ <img alt="Continuum Analytics" src="http://docs.continuum.io/_static/img/ContinuumWordmark.png" style="width:150px;min-height:30px" height="30px" width="150px"> ](http://continuum.io)

      You received this message because you are subscribed to the

Google Groups “Bokeh Discussion - Public” group.

      To unsubscribe from this group and stop receiving emails from

it, send an email to [email protected].

      To post to this group, send email to [email protected].

      To view this discussion on the web visit [https://groups.google.com/a/continuum.io/d/msgid/bokeh/cde2b833-4b77-ca84-4c33-64ef4a3875d1%40continuum.io](https://groups.google.com/a/continuum.io/d/msgid/bokeh/cde2b833-4b77-ca84-4c33-64ef4a3875d1%40continuum.io?utm_medium=email&utm_source=footer).

      For more options, visit [https://groups.google.com/a/continuum.io/d/optout](https://groups.google.com/a/continuum.io/d/optout).

  You received this message because you are subscribed to the Google

Groups “Bokeh Discussion - Public” group.

  To unsubscribe from this group and stop receiving emails from it,

send an email to [email protected].

  To post to this group, send email to [email protected].

To view this discussion on the web visit https://groups.google.com/a/continuum.io/d/msgid/bokeh/CAMOYv9ESshnOz%3DfOX1hkaATyjx0EBMQAaGQLt6EcYAsjMoMySw%40mail.gmail.com.

  For more options, visit [https://groups.google.com/a/continuum.io/d/optout](https://groups.google.com/a/continuum.io/d/optout).


Sarah Bird
Developer, Bokeh

    [
      <img alt="Continuum Analytics" src="http://docs.continuum.io/_static/img/ContinuumWordmark.png" style="width:150px;min-height:30px" height="30px" width="150px">
    ](http://continuum.io)

You received this message because you are subscribed to the Google Groups “Bokeh Discussion - Public” group.

To unsubscribe from this group and stop receiving emails from it, send an email to [email protected].

To post to this group, send email to [email protected].

To view this discussion on the web visit https://groups.google.com/a/continuum.io/d/msgid/bokeh/2a220174-8773-a701-56d2-15ef30b3899e%40continuum.io.

For more options, visit https://groups.google.com/a/continuum.io/d/optout.