Unique Hover Tool for multiple lines on same graph

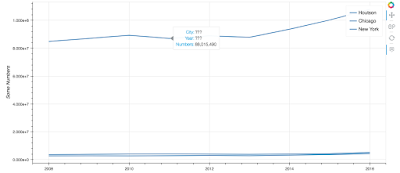
I am trying to customize the Hover Tool to display Column name, Index , and value for each line graph, however I can’t figure out how to access the column name and index value to display for each line graph. Is there a way to do this in Bokeh?

I have data that looks like this and will have more columns in the future.

Houston Chicago New York

2008 3561656 2712054 84846872

2009 3879058 2757302 87052104

2010 4047881 2687872 89292832

2011 4098648 2847405 87041208

2012 3996017 2995507 88945904

2013 3829361 2829287 87854568

2014 4029416 3211596 93676080

2015 4305298 3670746 100263208

2016 5217114 4317027 107957408

``

This is my code to create multiple line graphs on the same plot:

import pandas as pd

from bokeh.plotting import figure, output_file, show, ColumnDataSource
from bokeh.models import HoverTool,WheelZoomTool, PanTool, ResetTool

data = pd.read_csv('CITYTEST.csv', index_col =0)
print data

source = ColumnDataSource(data)

#This is not right...

hover = HoverTool(
 tooltips=[
 ( 'City' , '@columns'),
 ( 'Year', '@index'),
 ( 'Numbers', '$y{0,0}')
 ]
)

tools = [PanTool(), WheelZoomTool(), ResetTool(), hover]
p = figure(plot_width=1100, plot_height=500, tools = tools)

Cities = list(data.columns.values)
for i in range(0,3):
 p.line(x=data.index, y=data[Cities[i]], line_width = 2, legend = Cities[i])

p.yaxis.axis_label = 'Some Numbers'
p.xaxis.axis_label = 'Year'

show(p)

Is there a way I can change the hover tool to display City, Year, and value for each line in the graph separately?
There are a couple of questions like this on stack overflow.

I found this one helpful:

Especially the last answer, which sadly does not have any upvotes:

“You need to name your glyph with the name= attribute on the glyph that you are interested in having the hover tool active for and then set that name in the hover tool’s names= attribute. (Note the name= attribute of the fig.line glyph in the example below. [code example]”

That means you need to create one hover tool for each line you want to annotate in a different way.

A much more elegant solution could be to structure your data in a more efficient way:

Year City Value

2008 Houston 3561656

2008 Chicago 2712054

2008 New York 84846872

2009 Houston 3879058

2009 Chicago 2757302

2009 New York 87052104

2010 Houston 4047881

2010 Chicago 2687872

2010 New York 89292832

Then you should be able to use a single tooltip with options like these: (“@City”, etc. then refer to the actual name of the column.)

hover = HoverTool(
tooltips=[
( ‘City’ , ‘@City’),
( ‘Year’, ‘@Year’),
( ‘Numbers’, ‘@Value’)
]
)

···

Am Samstag, 3. März 2018 04:30:22 UTC+1 schrieb Tristan Schuler:

I am trying to customize the Hover Tool to display Column name, Index , and value for each line graph, however I can’t figure out how to access the column name and index value to display for each line graph. Is there a way to do this in Bokeh?

I have data that looks like this and will have more columns in the future.

Houston Chicago New York

2008 3561656 2712054 84846872

2009 3879058 2757302 87052104

2010 4047881 2687872 89292832

2011 4098648 2847405 87041208

2012 3996017 2995507 88945904

2013 3829361 2829287 87854568

2014 4029416 3211596 93676080

2015 4305298 3670746 100263208

2016 5217114 4317027 107957408

``

This is my code to create multiple line graphs on the same plot:

import pandas as pd

from bokeh.plotting import figure, output_file, show, ColumnDataSource
from bokeh.models import HoverTool,WheelZoomTool, PanTool, ResetTool

data = pd.read_csv('CITYTEST.csv', index_col =0)
print data

source = ColumnDataSource(data)

#This is not right...

hover = HoverTool(
 tooltips=[
 ( 'City' , '@columns'),
 ( 'Year', '@index'),
 ( 'Numbers', '$y{0,0}')
 ]
)

tools = [PanTool(), WheelZoomTool(), ResetTool(), hover]
p = figure(plot_width=1100, plot_height=500, tools = tools)

Cities = list(data.columns.values)
for i in range(0,3):
 p.line(x=data.index, y=data[Cities[i]], line_width = 2, legend = Cities[i])

p.yaxis.axis_label = 'Some Numbers'
p.xaxis.axis_label = 'Year'

show(p)

Is there a way I can change the hover tool to display City, Year, and value for each line in the graph separately?

I think there was a problem with the end of my previous message. Instead of the “div”, there was supposed to be the following code example for the new hovertool. Here we use “@” to refer to the actual column name.

hover = HoverTool(
tooltips=[
( ‘City’ , ‘@City’),
( ‘Year’, ‘@Year’),
( ‘Numbers’, ‘$Value’)
]
)

``

I figured out a solution by using the one of the solutions from this stack overflow link and using 能豆子’s solution. Thank you also to Joris. I wasn’t able to get either of those methods to work however.

···

On Friday, March 2, 2018 at 9:30:22 PM UTC-6, Tristan Schuler wrote:

I am trying to customize the Hover Tool to display Column name, Index , and value for each line graph, however I can’t figure out how to access the column name and index value to display for each line graph. Is there a way to do this in Bokeh?

I have data that looks like this and will have more columns in the future.

Houston Chicago New York

2008 3561656 2712054 84846872

2009 3879058 2757302 87052104

2010 4047881 2687872 89292832

2011 4098648 2847405 87041208

2012 3996017 2995507 88945904

2013 3829361 2829287 87854568

2014 4029416 3211596 93676080

2015 4305298 3670746 100263208

2016 5217114 4317027 107957408

``

This is my code to create multiple line graphs on the same plot:

import pandas as pd

from bokeh.plotting import figure, output_file, show, ColumnDataSource
from bokeh.models import HoverTool,WheelZoomTool, PanTool, ResetTool

data = pd.read_csv('CITYTEST.csv', index_col =0)
print data

source = ColumnDataSource(data)

#This is not right...

hover = HoverTool(
 tooltips=[
 ( 'City' , '@columns'),
 ( 'Year', '@index'),
 ( 'Numbers', '$y{0,0}')
 ]
)

tools = [PanTool(), WheelZoomTool(), ResetTool(), hover]
p = figure(plot_width=1100, plot_height=500, tools = tools)

Cities = list(data.columns.values)
for i in range(0,3):
 p.line(x=data.index, y=data[Cities[i]], line_width = 2, legend = Cities[i])

p.yaxis.axis_label = 'Some Numbers'
p.xaxis.axis_label = 'Year'

show(p)

Is there a way I can change the hover tool to display City, Year, and value for each line in the graph separately?