Hello.
Please advice, is there a possibility to update plot axis bound (Styling visual attributes — Bokeh 2.4.2 Documentation) with JS callback?
You should be able to set them the same as any other property in a JS callback, e.g.
CustomJS(args=dict(range=some_range), code="""
    range.bounds = [10, 20]
""")
Are you saying you have tried this and it does not work?
I’m not sure If we are on the same page. By bounds I mean object figure.xaxis.bounds not figure.x_range.bounds. I tried to change x-axis bounds it but it does not work.
Please take a look at the code below:
from bokeh.plotting import figure
from bokeh.io import show
from bokeh.layouts import row
from bokeh.models import Slider, CustomJS, ColumnDataSource

f = figure(plot_width=800, plot_height=500)
toy_dct = {'x':[1,2,3,4,5,7,9],'y':[1,1,1,1,1,3,4]}
f.line(x='x',y='y',source=ColumnDataSource(toy_dct))
f.xaxis.bounds = (1,7)
s = Slider(start=3,end=8,step=1,value=8)
s.js_on_change('value',CustomJS(args={'fig':f.xaxis,}, code="""
   var val = cb_obj.value;
   fig[0]['attributes']['bounds'] = [1,val-1];
"""))
show(row(s,f))
Sorry, axes bounds are a much more obscure setting than range bounds (I can’t recall anyone asking about it in 6 years). It’s changed int the same way, though, by changing the actual property on the object:
s.js_on_change('value', CustomJS(args=dict(axis=f.xaxis[0]), code="""
   var val = cb_obj.value
   axis.bounds = [1, val-1]
"""))
With very few exceptions, every property that you would ever set in Python code is exactly the same property you would set on a corresponding BokehJS object.
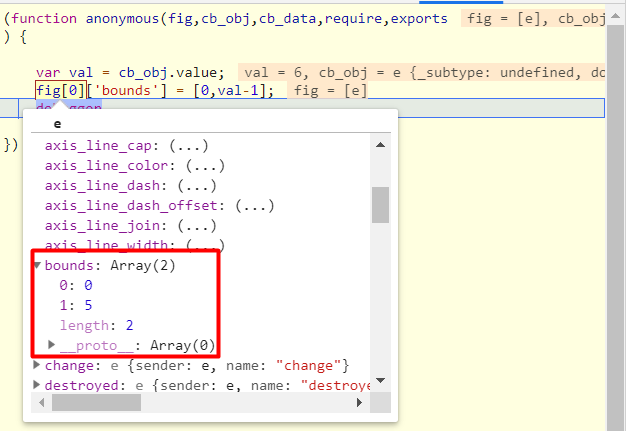
May I ask waht you saw that led you to try the approach you did? Users should never mess with the ["attributes"] dict directly (and should never need to). In fact doing that was precisely the problem here—all of the automatic updating and redrawing only triggers when real properties are set as above. We definitely don’t demonstrate or talk about ["attributes"] anywhere in the docs or examples, but if there was something you saw on SO or an old topic here, I can edit it, so please let me know.
Dear Bryan,
Thanks a lot for the clarification! I don’t remember have I ever seen an example with ["attributes"] editing.
I’ve simply missed the bounds property of the xaxis in the axis property list and was looking for the way how to change bounds.