Hello,
I trying to display some data (from a data frame) in one figure in a couple of different ways.
My test case has two options:
- y1-values are the same as the x-values
- y2-values are the square(y1)
These options are available to the user via a select widget.
The lineplot in the figure is updated, but I am failing to update the y-range in the figure.
My test code:
coding = utf-8
‘’’
To test figure behaviour when using a select-widget which triggers
changing the data source and changes of the y_ranges.
Changes to the data source are applied, but
the y_ranges are not updated.
‘’’
from bokeh.client import push_session
from bokeh.layouts import layout, widgetbox
from bokeh.models import ColumnDataSource
from bokeh.models.widgets import Select
from bokeh.plotting import curdoc, figure
import numpy as np
#imports necessary to start bokeh from inside this module
import time
import subprocess
class MyFigure():
def init(self, df, plot_height = 200, plot_width = 500, title = ‘Test’):
print(‘Init-start.’)
    self.df = df

    #numbered columns as strings width fixed length, left filled with zeros
    col_list = list(range(len(df.columns)))
    self.df.columns = [str(i).zfill(4) for i in col_list]

    self.plot_height = plot_height
    self.plot_width = plot_width

    # Defining options to be used with Select-widget
    self.select_options = ("y=x", "y=x*x")

    # ColumnDataSource is generated according the given display mode
    self.init_cds = {self.select_options[0] : self.cds_for_y_equals_x,
                     self.select_options[1] : self.cds_for_y_square}

    # Define the select widget
    self.select_widget_options = Select(title="Select options:",
                                        value=self.select_options[0],
                                        options=list(self.select_options))

    # Callback for select widget
    self.select_widget_options.on_change("value", self.select_option_handler)

    # Initialize figure with select option 'y=x'.
    self.set_fig_to_select_option(select_option = "y=x")

    # layout with widget and figure
    self.layout = layout([[widgetbox(self.select_widget_options)],[self.fig]],
                         sizing_mode='scale_width')

    print('Init-end.')

def select_option_handler(self, attr, old, new):
    '''Callback for Select widget.'''

    print('Select option changed from {} to: {}'.format(old, new))
    select_option = new
    self.set_fig_to_select_option(select_option)

def cds_for_y_equals_x(self):
    '''Returns a ColumnDataSource for self.df.'''

    source = ColumnDataSource(self.df)
    return source

def cds_for_y_square(self):
    '''Returns a ColumnDataSource for with y=y*y.

    Calculated from self.df, where y=x.'''

    df = self.df.apply(np.square)
    source = ColumnDataSource(df)
    #print(df)
    return source

def initialize_fig(self, plot_width, plot_height, select_option = "y=x"):
    '''Initialize a figure with the given options.'''

    # set the ColumnDataSource according the select option
    source = self.init_cds[select_option]()
    self.source = source

    # create the figure
    self.fig = figure(width = plot_width, height = plot_height)

    # x-values
    x = self.df.index.name

    # set y-values
    y_column_list = self.source.column_names
    y_column_list.remove(self.df.index.name) # remove the x-values
    y_column_list.sort()

    # create a line per y-name in the list
    for y in y_column_list:
        self.fig.line(x, y, source = self.source)

    # set axis ranges according select option
    self.set_axis_ranges(select_option)

    # set the value for the select widget
    self.select_widget_options.value = select_option

def set_axis_ranges(self, select_option):
    '''X- and -y-ranges according select option.'''

    y_ranges = {self.select_options[0] : (self.df.index.min(),
                                          self.df.index.max()), # for y=x
                self.select_options[1] : (0,
                                          np.square(self.df.index.max()))} # for y=x*x

    self.fig.x_range.start = self.df.index.min()
    print('fig.x_range.start = {}'.format(self.fig.x_range.start))

    self.fig.x_range.end = self.df.index.max()
    print('fig.x_range.end = {}'.format(self.fig.x_range.end))

    self.fig.y_range.start = y_ranges[select_option][0]
    print('fig.y_range.start = {}'.format(self.fig.y_range.start))

    self.fig.y_range.end = y_ranges[select_option][1]
    print('fig.y_range.end = {}'.format(self.fig.y_range.end))

def set_fig_to_select_option(self, select_option):
    '''Create or update figure according select option.'''

    source = self.init_cds[select_option]()

    try:
        self.fig # check that fig exists, otherwise AttributeError
        if self.source.data == source.data:
            print('set fig to {} - no change'.format(select_option))
        else:
            print('set fig to {} - update data source'.format(select_option))
            self.set_axis_ranges(select_option)
            self.source.data = source.data
    except AttributeError: # if fig does not exist, create fig
        self.initialize_fig(self.plot_width, self.plot_height)
if name == ‘main’:
import pandas as pd
import numpy as np
# start bokeh server
args = ['python', '-m', 'bokeh', 'serve']
p = subprocess.Popen(args)
time.sleep(1)

#create a test DataFrame
number_of_line_points = 10
array = np.linspace(-number_of_line_points/2, number_of_line_points/2,
                    num=number_of_line_points, endpoint=True)
df = pd.DataFrame(array, index = array)
df.index.name = 'x'

# create the figure
test = MyFigure(df)

# show the result
session = push_session(curdoc())
session.show(test.layout)
session.loop_until_closed()
``
Running the module gives the following console output:
Init-start.
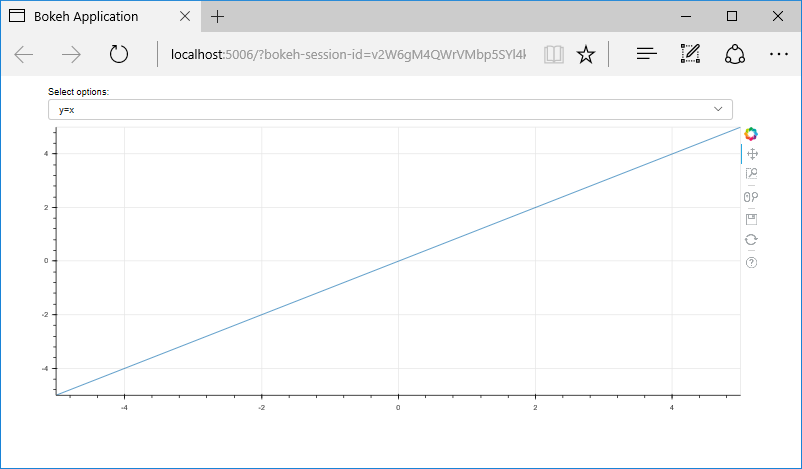
fig.x_range.start = -5.0
fig.x_range.end = 5.0
fig.y_range.start = -5.0
fig.y_range.end = 5.0
Init-end.
2016-12-04 14:20:15,494 Starting Bokeh server version 0.12.3
2016-12-04 14:20:15,501 Starting Bokeh server on port 5006 with applications at paths [‘/’]
2016-12-04 14:20:15,501 Starting Bokeh server with process id: 2696
2016-12-04 14:20:15,547 WebSocket connection opened
2016-12-04 14:20:15,548 ServerConnection created
2016-12-04 14:20:15,848 200 GET /?bokeh-session-id=oCmKHM3OUQiZ5BvSN87ef3rUiHdmgqBXJW9Hda90i0Sy (::1) 12.51ms
2016-12-04 14:20:16,167 WebSocket connection opened
2016-12-04 14:20:16,168 ServerConnection created
``
and the ‘figure bokeh_plot_init=x.png’
Changing the selection to y=x*x gives some error messages and the following output on the console:
2016-12-04 14:23:33,113 received invalid integer in pong b’’
Traceback (most recent call last):
File “C:\Users\mdk\Miniconda3\lib\site-packages\bokeh\server\views\ws.py”, line 167, in on_pong
self.latest_pong = int(codecs.decode(data, ‘utf-8’))
ValueError: invalid literal for int() with base 10: ‘’
2016-12-04 14:24:08,514 received invalid integer in pong b’’
Traceback (most recent call last):
File “C:\Users\mdk\Miniconda3\lib\site-packages\bokeh\server\views\ws.py”, line 167, in on_pong
self.latest_pong = int(codecs.decode(data, ‘utf-8’))
ValueError: invalid literal for int() with base 10: ‘’
2016-12-04 14:24:45,514 received invalid integer in pong b’’
Traceback (most recent call last):
File “C:\Users\mdk\Miniconda3\lib\site-packages\bokeh\server\views\ws.py”, line 167, in on_pong
self.latest_pong = int(codecs.decode(data, ‘utf-8’))
ValueError: invalid literal for int() with base 10: ‘’
2016-12-04 14:25:22,516 received invalid integer in pong b’’
Traceback (most recent call last):
File “C:\Users\mdk\Miniconda3\lib\site-packages\bokeh\server\views\ws.py”, line 167, in on_pong
self.latest_pong = int(codecs.decode(data, ‘utf-8’))
ValueError: invalid literal for int() with base 10: ‘’
Select option changed from y=x to: y=xx
set fig to y=xx - update data source
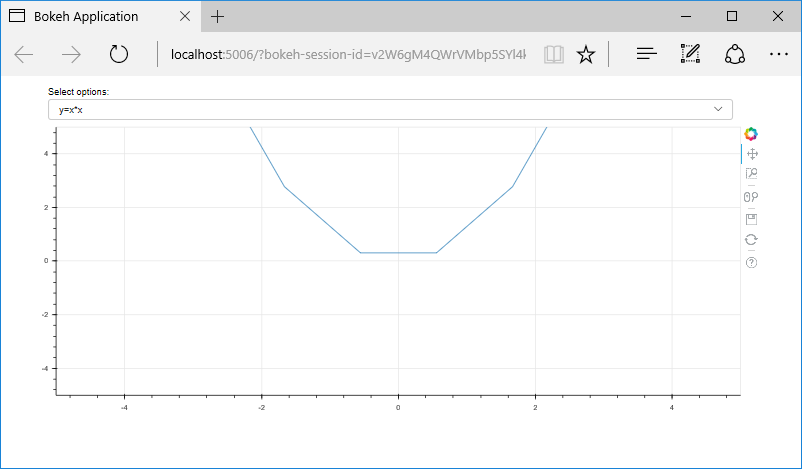
fig.x_range.start = -5.0
fig.x_range.end = 5.0
fig.y_range.start = 0
fig.y_range.end = 25.0
2016-12-04 14:25:59,514 received invalid integer in pong b’’
Traceback (most recent call last):
File “C:\Users\mdk\Miniconda3\lib\site-packages\bokeh\server\views\ws.py”, line 167, in on_pong
self.latest_pong = int(codecs.decode(data, ‘utf-8’))
ValueError: invalid literal for int() with base 10: ‘’
2016-12-04 14:26:36,521 received invalid integer in pong b’’
Traceback (most recent call last):
File “C:\Users\mdk\Miniconda3\lib\site-packages\bokeh\server\views\ws.py”, line 167, in on_pong
self.latest_pong = int(codecs.decode(data, ‘utf-8’))
ValueError: invalid literal for int() with base 10: ‘’
2016-12-04 14:27:13,516 received invalid integer in pong b’’
Traceback (most recent call last):
File “C:\Users\mdk\Miniconda3\lib\site-packages\bokeh\server\views\ws.py”, line 167, in on_pong
self.latest_pong = int(codecs.decode(data, ‘utf-8’))
ValueError: invalid literal for int() with base 10: ‘’
2016-12-04 14:27:50,516 received invalid integer in pong b’’
Traceback (most recent call last):
File “C:\Users\mdk\Miniconda3\lib\site-packages\bokeh\server\views\ws.py”, line 167, in on_pong
self.latest_pong = int(codecs.decode(data, ‘utf-8’))
ValueError: invalid literal for int() with base 10: ‘’
2016-12-04 14:28:27,514 received invalid integer in pong b’’
Traceback (most recent call last):
File “C:\Users\mdk\Miniconda3\lib\site-packages\bokeh\server\views\ws.py”, line 167, in on_pong
self.latest_pong = int(codecs.decode(data, ‘utf-8’))
ValueError: invalid literal for int() with base 10: ‘’
``
and the ‘bokeh_plot_select_y=yy.png’
The data are updated, the line plot is updated, but the y-range is not.
The values for figure.y_range.start and figure.y_range.end seem to be set to the correct values, but it does not show in the figure.
What am I missing? And what meaning have the error messages?
Thanks
Daniel