Hello, I’m new to bokeh, I’m trying to plot an interactive map to display several clusters, but I can’t get to update the map with the slider due to an error on the python callback, I tried to use a JS callback but I don’t know the language.
#Define function that returns json_data for year selected by user.

def json_data(selectedMonth):
    Month = selectedMonth
    df_yr = Q4[Q4['variable'] == Month]
    Map_clusters_Q4 = Geometry.merge(ClustersQ4, how='outer', on=['MPIO_CNMBR'])
    Map_clusters_Q4_json = json.loads(Map_clusters_Q4.to_json())
    json_data = json.dumps(Map_clusters_Q4_json)
    return json_data

#Input GeoJSON source that contains features for plotting.
geosource = GeoJSONDataSource(geojson = json_data(9))

#Define a sequential multi-hue color palette.
palette = brewer['Spectral'][4]

#Instantiate LinearColorMapper that linearly maps numbers in a range, into a sequence of colors. Input nan_color.
color_mapper = LinearColorMapper(palette = palette, low = 1.0, high = 4.0, nan_color = '#d9d9d9')

#Define custom tick labels for color bar.
tick_labels = {'1': '1er Cuartil', '2': '2do Cuartil', '3':'3er Cuartil', '4':'4to Cuartil'}

#Add hover tool
hover = HoverTool(tooltips = [ ('Municipio','@MPIO_CNMBR'), ('Percentil', '@Clusters_Q4')])

#Create color bar.
color_bar = ColorBar(color_mapper = color_mapper, label_standoff = 4, width = 500,
                     height = 15, border_line_color = None, location = (0,0),
                     orientation = 'horizontal', major_label_overrides = tick_labels)

#Create figure object.
p = figure(title = 'Cluster Q4 mes 8',
           plot_height = 950 , plot_width = 950,
           toolbar_location = None, tools = [hover])

p.xgrid.grid_line_color = None
p.ygrid.grid_line_color = None

#Add patch renderer to figure.
p.patches('xs','ys', source = geosource,fill_color = {'field' :'Clusters_Q4', 'transform' : color_mapper},
          line_color = 'black', line_width = 1, fill_alpha = 1)

p.add_layout(color_bar, 'below')

#Define the callback function: update_plot
def callback(attr, old, new):
    Month = slider.value
    new_data = json_data(Month)
    geosource.geojson = new_data
    p.title.text = 'Cluster Q4 mes %d' %Month

# Make a slider object: slider
slider = Slider(title = 'Mes',start = 2, end = 9, step = 1, value = 9)
slider.on_change('value', callback)

# Make a column layout of widgetbox(slider) and plot, and add it to the current document
layout = column(p,slider)
curdoc().add_root(layout)

#Display plot inline in Jupyter notebook
output_notebook()

#Display plot
show(layout)
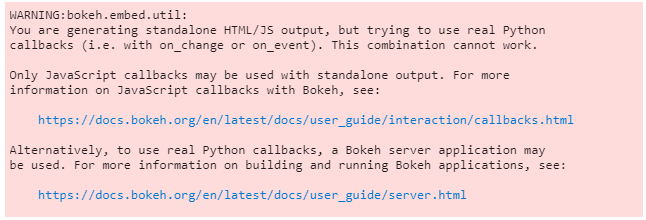
And I keep getting this error