I recently updated to Bokeh 1.4.0, mainly to take advantage of auto-scaling y-axes with legend visibility toggling that was enabled with #9144. This new feature is great! However, this update has introduced a new unexpected change for my app.
I have both a DateRangeSlider and RadioGroup buttons to change the displayed time range. On page load, my default view is for the previous 48 hrs. Such as:
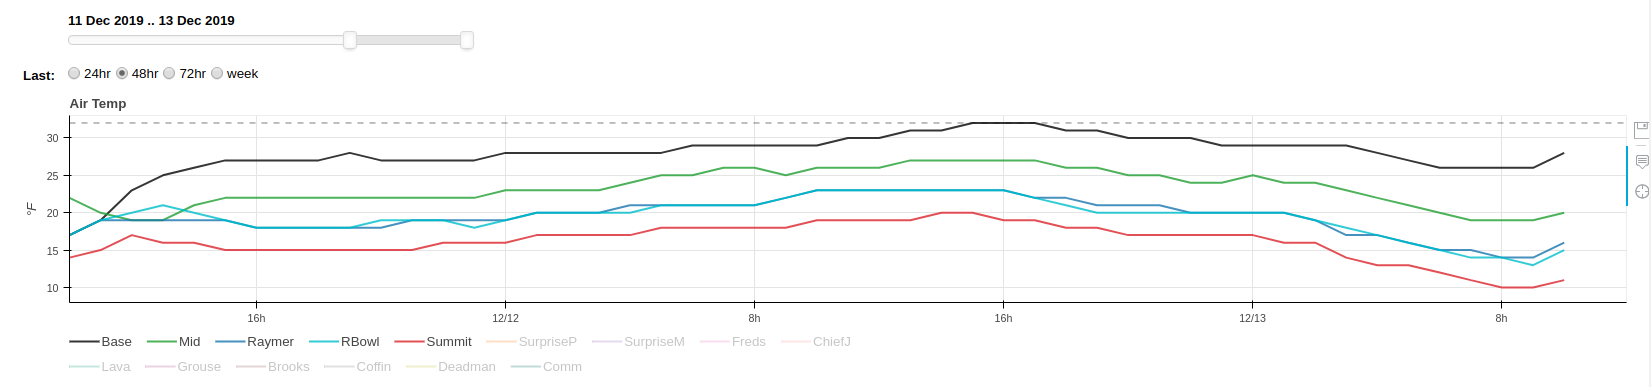
When I adjust the DateRangeSlider or select a RadioButton, I have functions that update the figure’s
x_range.start and x_range.end as well as scale the the y-axis range to the new range of the data.
Previously, if I changed the time range with one of these widgets and then toggled a legend item, it would simply appear in the plot with the new x_range. Now, when I toggle any legend item, it automatically changes the x_range view back to the default 48 hrs. This is new and unexpected behavior that has resulted from the version update.
Note: This app has multiple panels (figures), and I have enabled the y-axis scaling that was provided with #9144 on only one of these panels. All the other panels (including the one with screenshot above) remain unchanged. The issue described above occurs on all panels, and is unrelated to whether or not I use y_range=DataRange1d(only_visible=True).
Any ideas as to what is going on here??
If it is helpful, here is my code to create the figure above:
def make_airtemp_fig(station_list, label_list, hide_list, legend_out):
  '''
  Create the air temp panel and plot data

  Parameters
  ----------
  station_list: list of dataframes, in legend display order
  label_list: list of label strings, in legend display order
  hide_list: list of label strings for initial setting of visible=False, any order
  legend_out: boolean, True puts legend outside, False keeps legend inside

  Returns
  -------
  p: Bokeh Figure object
  '''
  valid_stations = []
  valid_labels = []
  valid_colors = []

  for station, label in zip(station_list, label_list):
    if not station.empty: # check for empty dataframes
      valid_stations.append(station)
      valid_labels.append(label)
      valid_colors.append(color_dict[label])

  global valid_labels_airtemp # used in update_yrange functions
  valid_labels_airtemp = valid_labels

  cds = create_cds(valid_stations, valid_labels, 'air_temp')

  p = figure(
      title="Air Temp",
      name="airtemp_fig",
      x_axis_type='datetime',
      y_axis_label='°F',
      width=width, height=height,
      tools=tools,
  )
  p.toolbar.logo = None
  p.yaxis.minor_tick_line_color = None  # turn off y-axis minor ticks

  legenddict={}
  items=[]
  tooltips=[("Date", "@Date_hover")]
  for color, label in zip(valid_colors, valid_labels):
    legenddict[label] = p.line(x='Date', y=label, line_width=2, color=color, alpha=0.8, name=label, source=cds)
    items.append((label,[legenddict[label]]))
    tooltips.append(("%s" % label, "@%s{int}" % label))

  hline = Span(location=32, dimension='width', line_color='black',
               line_width=1, line_dash='dashed', line_alpha=0.5, level='underlay')
  p.renderers.extend([hline])

  p.yaxis.axis_label_standoff = 10

  p.add_tools(HoverTool(
      renderers=[legenddict[valid_labels[0]]],
      tooltips=tooltips,
      line_policy="nearest",
      mode='vline'
      )
  )

  if legend_out==True:
    legend1 = Legend(
        items=items[0:9],
        location=(0, 15),
        glyph_height=20,
        glyph_width=30,
        label_height=1,
        #label_width=50,
        label_text_baseline="middle",
        label_text_font_size="10pt",
        border_line_alpha=0.0,
        orientation="horizontal",
        padding=0, #only applies when border visible
        spacing=15,
        label_standoff=2,
        #margin=10
    )

    legend2 = Legend(
        items=items[9:],
        location=(0, 10),
        glyph_height=20,
        glyph_width=30,
        label_height=1,
        #label_width=50,
        label_text_baseline="middle",
        label_text_font_size="10pt",
        border_line_alpha=0.0,
        orientation="horizontal",
        padding=0, #only applies when border visible
        spacing=15,
        label_standoff=2,
        margin=0
    )

    p.add_layout(legend1, 'below')
    p.add_layout(legend2, 'below')
    p.legend.click_policy="hide"

  else:
    legend = Legend(
        items=items,
        location='top_left'
    )

    p.add_layout(legend)
    p.legend.click_policy="hide"

  for x in hide_list: # go through stations on the hide_list
    if p.select_one({'name':'%s' % x}): # check if the line glyph is present
      p.select_one({'name':'%s' % x}).visible = False
  return p