I’m trying to update an offset bar plot based on two selectors. I’m currently able to update the bars and the legends on the plot. I’ve tried to update the tooltips by changing the plot.toolbar.tool[hover].tooltips array, it works perfect just once, but if I try to change again my selection all the other data updates, but the tooltips doesn’t change anymore.
default_ports = ['VAL1', 'VAL2']
pbar = figure(x_range=months, title="Title",
           height=350,width=1000, toolbar_location="right", tools="pan,wheel_zoom,box_zoom,reset,save")

plot_data = [
       {"color": "#c9d9d3", "phase": -0.2},
       {"color": "#718dbf", "phase": 0.2},
]


for i,port in enumerate(default_ports):
       pbar.vbar(x=dodge('months', plot_data[i]["phase"], range=pbar.x_range), top=f"port{i}", source=subset_data,
              width=0.4, color=plot_data[i]["color"], legend_label=port)


pbar.add_tools(HoverTool(
        tooltips=[
            ( 'Month',   '@months'            ),
            ( "VAL1",  '@port0' ),
            ( "VAL2"",  '@port1' ),
        ],
        mode='vline'
    ))

callback = CustomJS(
        args={
        "legends": pbar.legend.items,
        "subset_data": subset_data,
        "source": source,
        "months": months,
        "plot": pbar,
        "initial_tooltips": pbar.hover.tooltips},
        code="""
            const val = this.value;
            var current_labels = [];
            for(let i=0; i<2; i++){
                current_labels.push(legends[i].label["value"]);
            }

            if(this.title == "Port 1:"){
                legends[0].label["value"] = val;
            } else{
                legends[1].label["value"] = val;
            }

            var new_data = {};
            var tooltips = initial_tooltips;
            for(let i=0;i<2;i++){
                var label = legends[i].label["value"];
                var tag = "port" + i;
                tooltips[i+1][0] = label;
                new_data[tag] = source.data[label];
            }
            new_data["months"] = months;
            subset_data.data = new_data;

            subset_data.change.emit();
            plot.toolbar.tools[5].tooltips = tooltips;


            plot.change.emit();
            console.log("p",plot);
        """)

            #


port1_selector = Select(title="Port 1:", value="VAL1", options=ports)
port1_selector.js_on_change("value", callback)

port2_selector = Select(title="Port 2:", value="VAL2", options=ports)
port2_selector.js_on_change("value", callback)
Actually if I check the js object the changes are made, but the visual doesn’t make any changes.
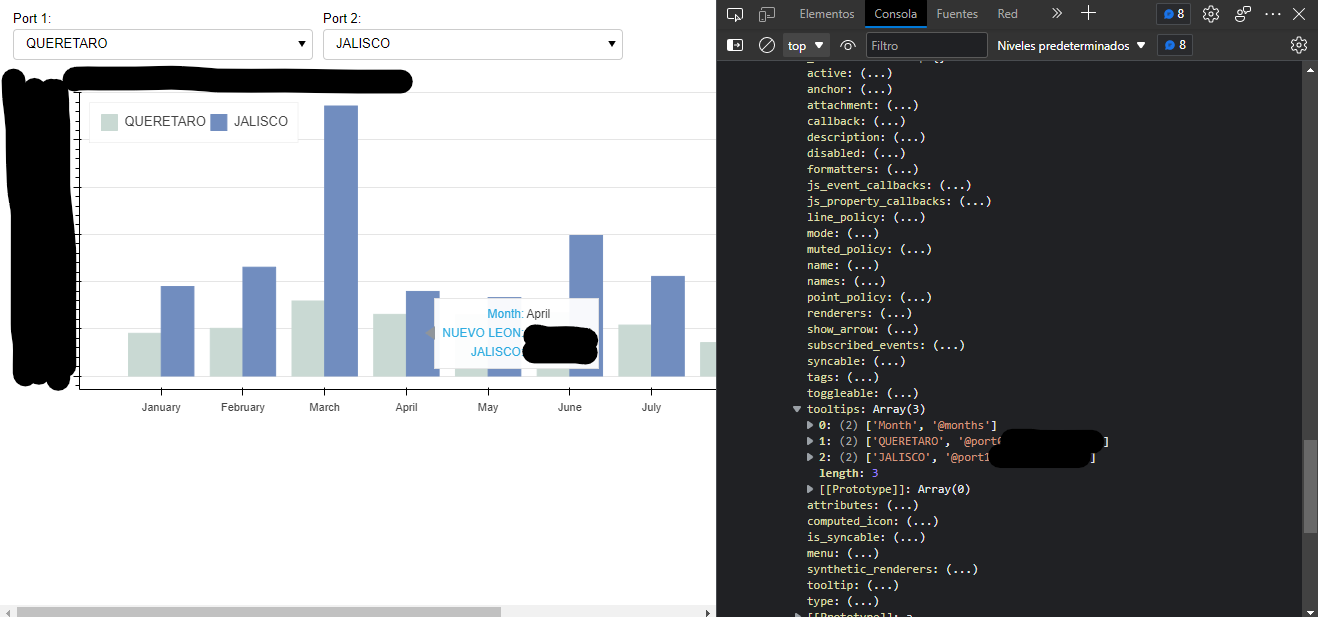
Here’s how it looks after changing the Port 1 selection, the data is correctly assigned on the bars and the legends, but the tooltips didn’t change after the first selection.