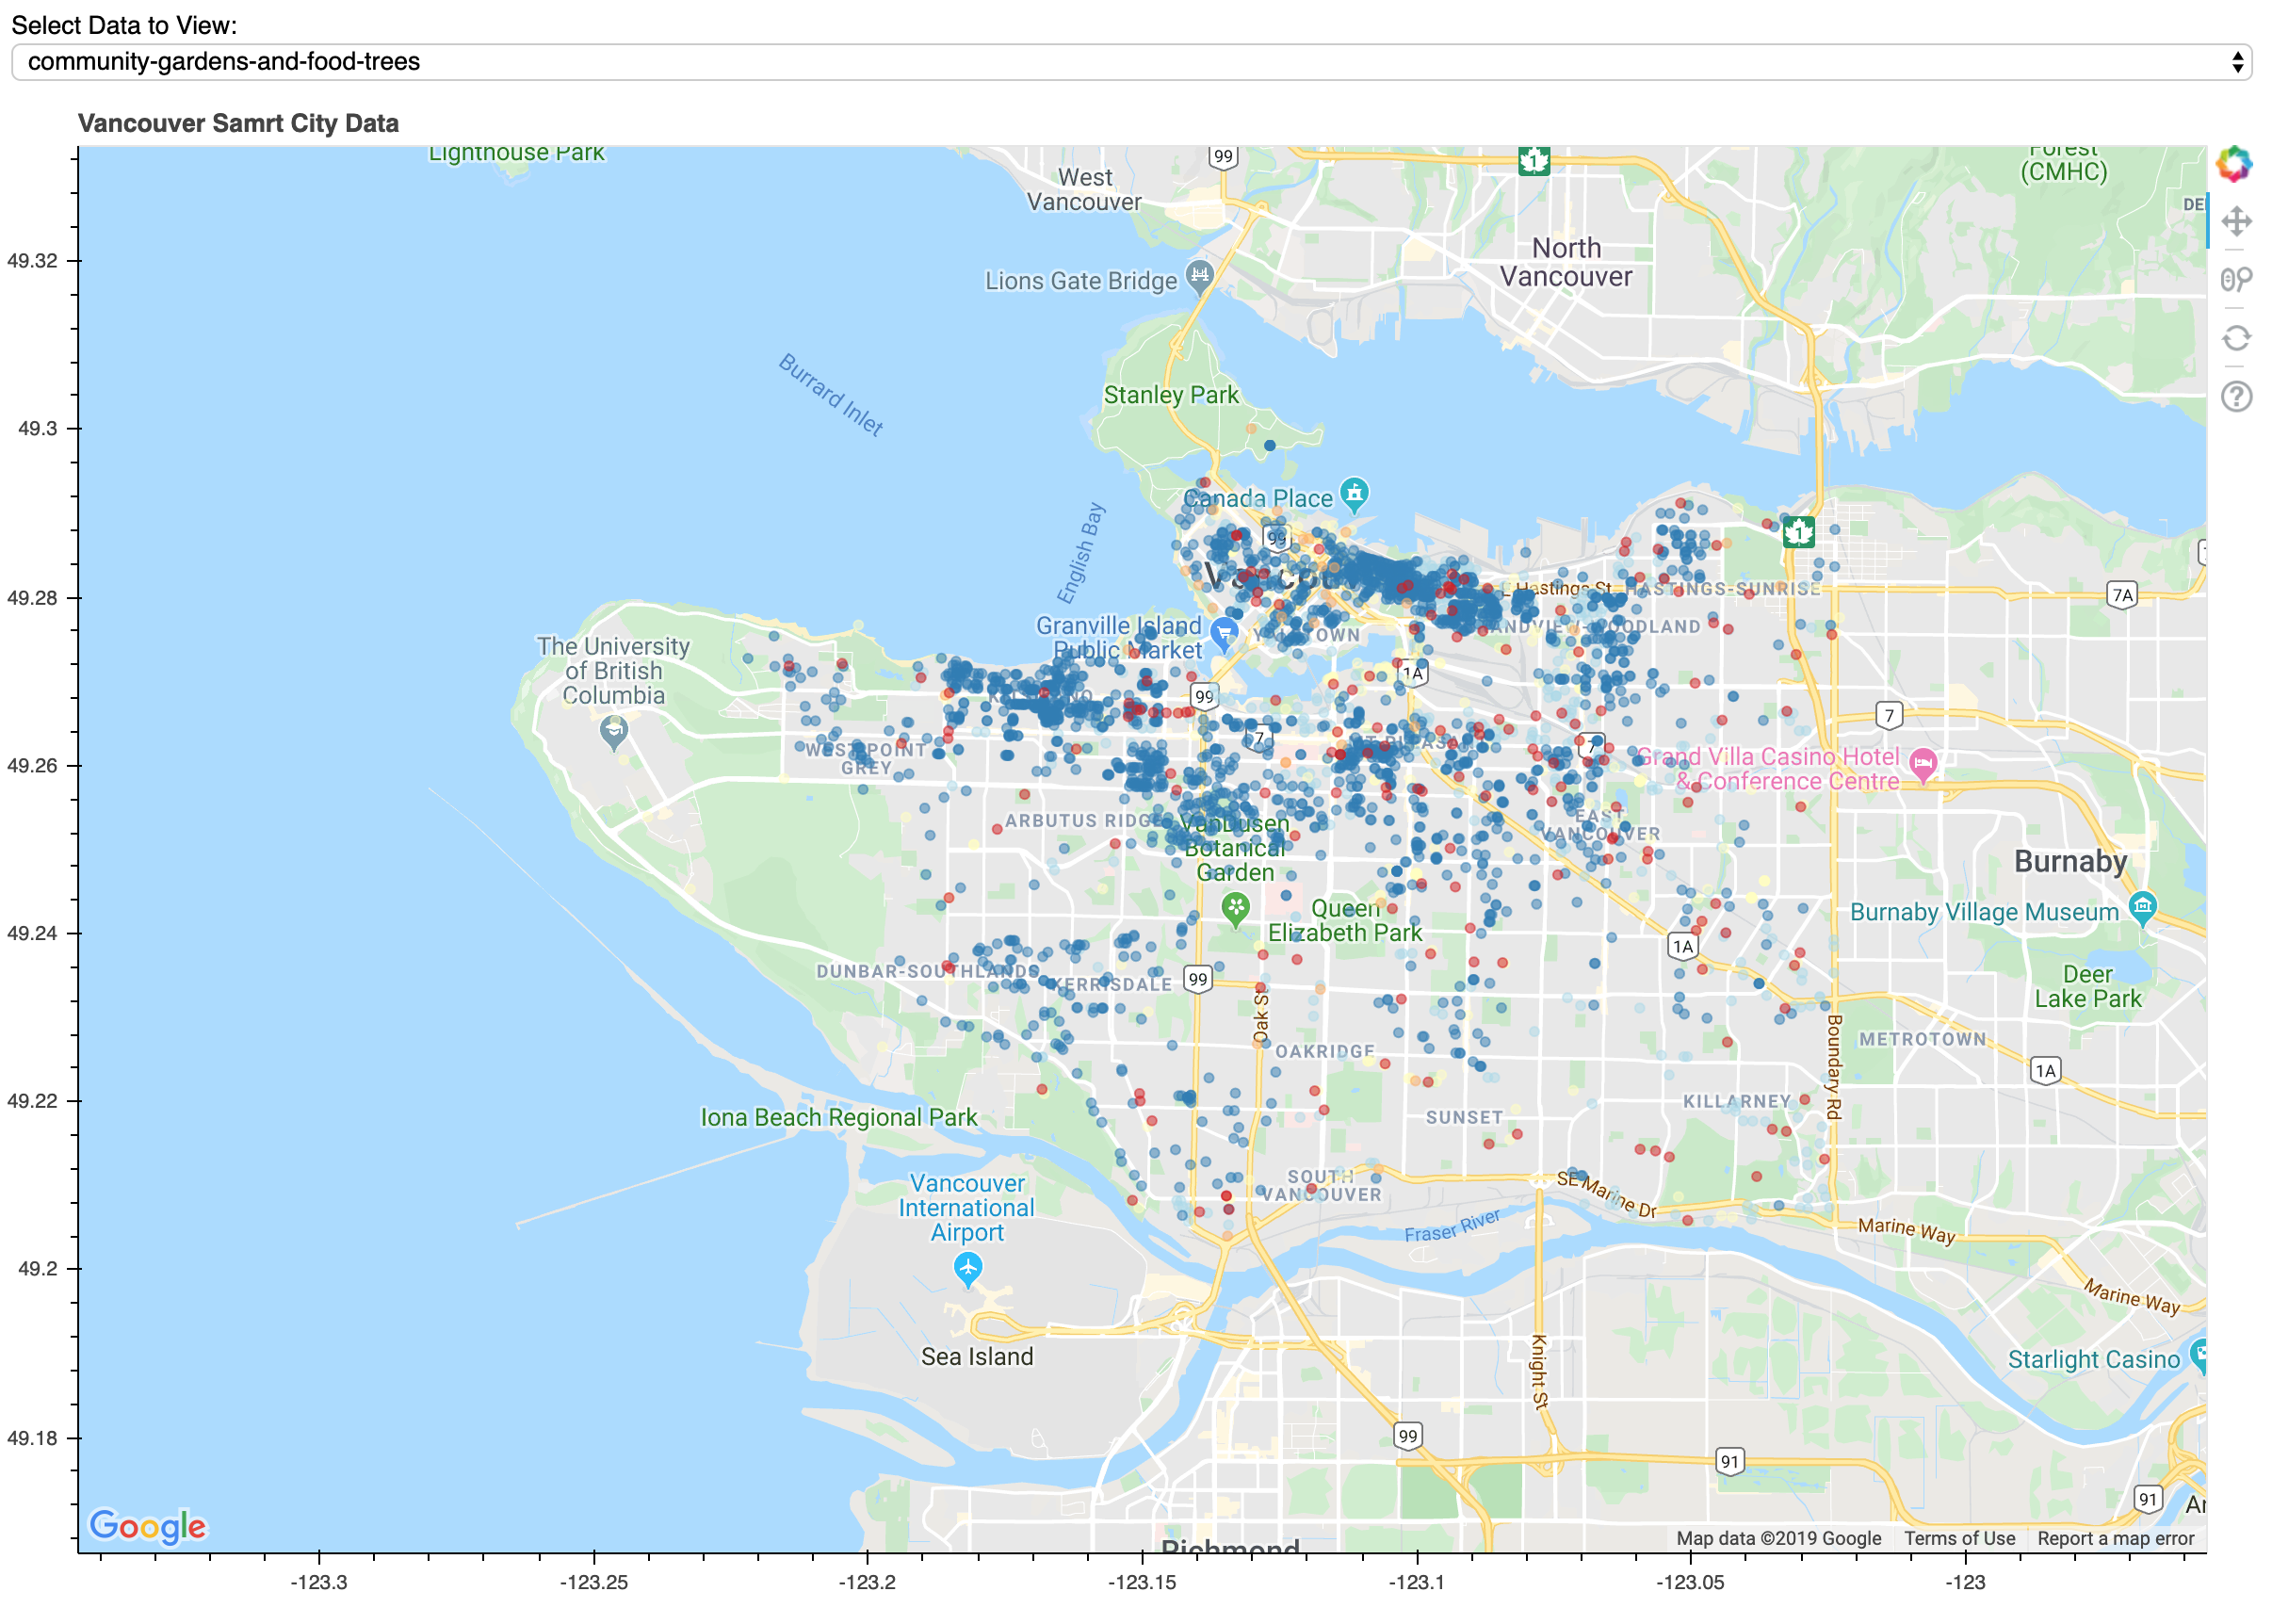
I’m working on a server app for an urban smart cities project and have been making good progress building up a little bokeh workbench. However, I can’t quite get the select feature to work as expected. It’s not updating and nothing is showing in the plot (attached plot is from earlier). Strangely, it’s not displaying any errors in the terminal or the dev console. It also seems to report the changes back to the server and back again to the console so i’m not sure where to look next. Do anyone have any suggestions for this code?
import pandas as pd

from bokeh.models import GMapOptions, ColumnDataSource, GMapPlot, Range1d, CustomJS
from bokeh.plotting import figure, gmap, curdoc
from bokeh.palettes import RdYlBu, linear_palette, brewer
from bokeh.models.widgets import Select
from bokeh.layouts import column

#import data
input_json_string = #mypath
inmemory_json_df = pd.read_json(input_json_string, orient="records")

# process dataframe into column data sources by source file type
dict_groups = inmemory_json_df.groupby("sourcefile")

# Get name of sources into a list for later use // This can be simplifed with above
option_types = []
for i, o in dict_groups:
   option_types.append(i)

source = ColumnDataSource(data=dict({
   "geometry.lng" : [],
   "geometry.lat" : [],
}))

def select_trigger(attrname, old, new):
    update()

def get_data(source_file_name, df_obj):
   loaded_df = df_obj[df_obj["sourcefile"] == source_file_name]
    XS = loaded_df["geometry.lng"].tolist()
    YS = loaded_df["geometry.lng"].tolist()
    output_dict = dict({
        "geometry.lng":XS,
        "geometry.lat":YS,
    })

return output_dict

def update():
    selected_source = select_data_menu.value
    data = get_data(selected_source, inmemory_json_df)
    source.data = data

# google api + graphic options
api_key = #mykey
map_options = GMapOptions(lat=49.25, lng=-123.15, map_type="roadmap", zoom=12)
color_list = brewer["RdYlBu"][5]
select_data_menu = Select(title="Select data to view:", value=option_types[0], options=option_types)

#graphics
plot = gmap(api_key, map_options)
plot.title.text = "Smart City Data"
plot.plot_height = 800
plot.plot_width = 1200

#special graphics engine
plot.circle(x="geometry.lng", y="geometry.lat", size=10, alpha=0.76, color="goldenrod", source=source)

callback = CustomJS(args=dict(source=source), code="""
console.log("update triggered");
""")

select_data_menu.on_change("value", select_trigger)
select_data_menu.js_on_change('value', callback)

# final add to document
layout = column(select_data_menu, plot)
update()
curdoc().add_root(layout)
curdoc().title = "Smart City Data"