Akshay,
I apologize but unfortunately I do not have the time to dig into this in detail, especially since I can’t actually run it without actual data (tho perhaps someone else will be able to). But I can offer some general advice:
One really nice thing about JS callbacks is that they make debugging in the browser easy to do. You can put a line “debugger” in your JS code, then you run your script like this:
BOKEH_MINIFIED=no python my_script.py
Then you open the page with browser “dev tools” enabled, the code will stop on the “debugger” line and open in the JS debugger, and you can examine the values of the variables, single step through the JS code, etc.
I would also recommend starting from a known working place, and incrementally adding/changing it. So, start from the example I linked earlier, and first make it work with a tap tool instead of a hover tool, then incrementally add in new data sources/glyphs more like your actual data, in small steps. This will let you have some idea what step might actually be causing a problem.
Thanks,
Bryan
On Mar 21, 2016, at 8:17 AM, Akshay Avvaru [email protected] wrote:
Hi Bryan,
Thanks for the reply I have attached the code here as you can see. I have checked the code quite a few times and couldn't underastand whats going wrong. It might me something basic syntax. Please Help me!
p_source = ColumnDataSource(data = scatter_src)
kingdom_cds = ColumnDataSource(data = kingdoms)
group_cds = ColumnDataSource(data = groups)
subgroup_cds = ColumnDataSource(data = subgroups)
p = figure(title = “Kingdoms”, plot_width = 800, plot_height = 560, x_range = p_source.data[‘x’], tools = “tap, pan, box_zoom, wheel_zoom, resize, reset, save”)
p.circle(‘x’, ‘y’, size = 10, source = p_source)
callback = CustomJS(code = “”"
var select = cb_obj.get('selected')['1d'].indices;

var s_data = source.get('data');

var select_x = s_data['x'][select];

var level = s_data['level'];

var kingdoms = kingdoms_cds.get('data');

var groups = groups_cds.get('data');

var subgroup = subgroups_cds.get('data');

if (level == 'Kingdoms'){

	var s_groups = kingdoms[select_x];

	var len_grp = s_groups.length;

	var sg_sizes = new Array(len_grp);

	var grp;

	for (grp in s_groups){

		var size = groups[grp].length;

		sg_sizes.push(size);}

	p.set('title',"Groups");

	s_data['x'] = s_groups;

	s_data['y'] = sg_sizes;

	s_data['level'] = "Groups";

}else if (level == 'Groups'){

	var s_subgroups = groups[select_x];

	var len_sgrp = s_subgroups.length;

	var ssg_sizes = new Array(len_sgrp);

	var subgrp;

	for (subgrp in s_subgroups){

		var size = subgroups[subgrp].length;

		ssg_sizes.push(size);}

	p.set('title',"Sub Groups");

	s_data['x'] = s_subgroups;

	s_data['y'] = ssg_sizes;

	s_data['level'] = "Subgroups";

}

source.trigger('change');

p.trigger('change');

""")
callback.args[“p”] = p
callback.args[“source”] = p_source
callback.args[“kingdoms_cds”] = kingdom_cds
callback.args[“groups_cds”] = group_cds
callback.args[“subgroups_cds”] = subgroup_cds
tapselect = p.select(type = TapTool)
tapselect.callback = callback
output_file(“tapselect.html”)
show(p)
On Monday, March 21, 2016 at 6:09:10 PM UTC+5:30, Akshay Avvaru wrote:
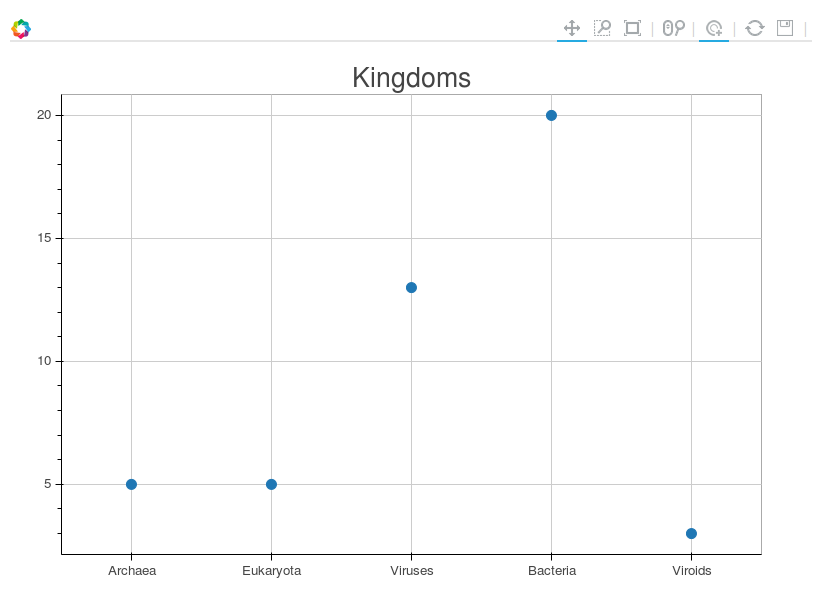
As show in the figure I have plotted information for kingdoms in an example data set. I want to write a CustomJS callback for the TapTool such that when a kingdom is clicked the plot updates with the information of the Groups in that Kingdom. That is a new plot is made with Groups in the selected kingdom. I have been trying this for very long and I wanted to know if this is really possible. Thanks in advance.
–
You received this message because you are subscribed to the Google Groups “Bokeh Discussion - Public” group.
To unsubscribe from this group and stop receiving emails from it, send an email to [email protected].
To post to this group, send email to [email protected].
To view this discussion on the web visit https://groups.google.com/a/continuum.io/d/msgid/bokeh/51b93ede-4973-4ccd-ba78-002913e4ed76%40continuum.io.
For more options, visit https://groups.google.com/a/continuum.io/d/optout.
–
You received this message because you are subscribed to the Google Groups “Bokeh Discussion - Public” group.
To unsubscribe from this group and stop receiving emails from it, send an email to [email protected].
To post to this group, send email to [email protected].