Dear all,
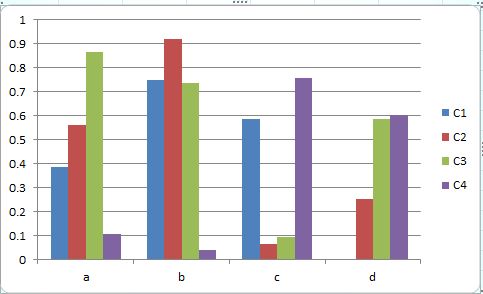
I would like to a graph as the one attached. I believe this is only feasible using high level Bar chart applied to a DataFrame.
I also need to have that chart updated through user interaction (a select control that will change the DataFrame) but as far as I know this is not feasible though update method which are only available on low level api making use of ColumnDataSource.
Hence, I do not really know how to proceed and I am wondering if there is a solution with current Bokeh library.
Thank you in advance for your help.