I’m trying to create a plot that compares two stocks. Here’s what the output looks like.
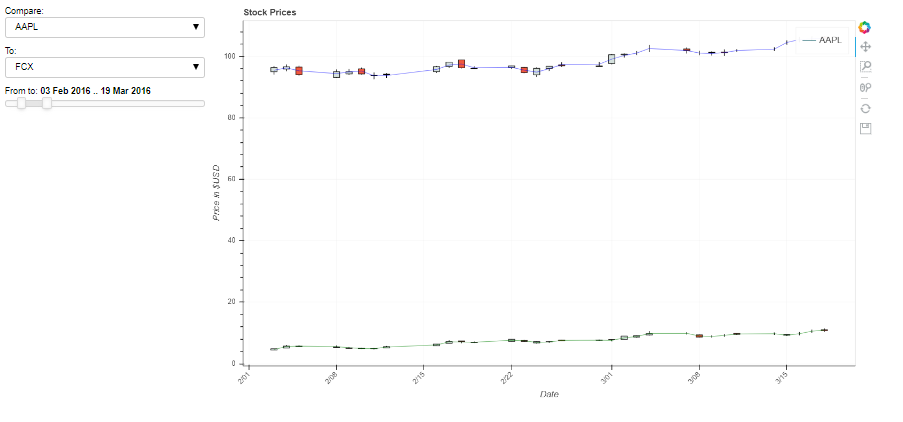
I want to create two legends label instead of just 1. I tried using legend_label and legend_group. However, when using with callback function, they won’t update the legend labels. The only option that works is using legend_field. But this one only shows 1 legend. \
Below is the code to create the plot
```from math import pi

import datetime

from datetime import date

import pandas as pd

import numpy as np

from bokeh.plotting import figure, output_file, show

from bokeh.layouts import layout, widgetbox

from bokeh.io import curdoc

from typing import Tuple, List

from bokeh.models import ColumnDataSource, Select, DateRangeSlider, Dropdown

from bokeh.io import curdoc

from bokeh.layouts import row, column```
#Start code:
 df['shortened_date'] = pd.to_datetime(df['date'],format='%Y-%m-%d')

 year = 2016

 data = df.loc[(df['symbol'] == 'AAL') & (df['shortened_date'].dt.year == year),:]

 stock = ColumnDataSource(data = {'shortened_date': data.shortened_date, 'high': data.high , 'low': data.low, 'mean':data[['high','low']].mean(axis=1), 'name': data['symbol']})


 def get_data(*args, stock_name: str='AAL', year:int =year) -> pd.DataFrame:
     data = df.loc[(df['symbol'] == stock_name) & (df['shortened_date'].dt.year == year),:]
     stock = ColumnDataSource(data = {'shortened_date': data.shortened_date,
     'high': data.high ,
     'low': data.low,
     'mean':data[['high','low']].mean(axis=1),
     'name': data['symbol']})

     inc = data.close > data.open
     dec = data.open > data.close

     stock_day = ColumnDataSource(data = {'inc': data.shortened_date[inc],
                                      'dec': data.shortened_date[dec],
                                      'open_inc': data.open[inc],
                                      'close_inc': data.close[inc],
                                      'open_dec': data.open[dec],
                                      'close_dec': data.close[dec]})
     return stock, stock_day

 def yeardata(year:int = year):
     unique_stocks = df['symbol'].unique()
     year_data = df.loc[df['shortened_date'].dt.year==year]
     return year_data, unique_stocks

 year_data, unique_stocks = yeardata(year=year)
 # half day in ms
 w = 12*60*60*1000
 range_slider = DateRangeSlider(start=year_data['shortened_date'].min(),
                                end=year_data['shortened_date'].max(),
                                value=(date(2016,2,3),date(2016,3,3)),
                                step=1, title="From to")
 Select1 = Select(title='Compare:', value='AAL', options=list(unique_stocks))
 Select2 = Select(title='To:', value='GD', options=list(unique_stocks))
 TOOLS = "pan,wheel_zoom,box_zoom,reset,save"

 plot = figure(title='Stock Prices',
               x_axis_type="datetime",
               tools=TOOLS,
               plot_width=1000,
               y_axis_label='Price in $USD',
               x_axis_label='Date')

 plot.xaxis.major_label_orientation = pi/4
 plot.grid.grid_line_alpha=0.3

 def candle_plot(stocks: List, plot:figure=plot, color='blue'):
     stock, stock_day = stocks
     name = stock.data['name'].values[0]
     label = 'Mean price of ' + name
     plot.segment('shortened_date', 'high', 'shortened_date', 'low', color="black", source=stock)
     plot.vbar('inc', w, 'open_inc', 'close_inc', fill_color="#D5E1DD",
            line_color="black",source=stock_day)
     plot.vbar('dec', w, 'open_dec', 'close_dec', fill_color="#F2583E",
            line_color="black",source=stock_day)
     plot.line('shortened_date', 'mean',
            legend_field='name', muted_alpha=0.2,
            line_color=color, alpha=0.5, source=stock)

 stock1, stock1_day = get_data(stock_name='AAL')
 candle_plot(stocks=[stock1, stock1_day], plot=plot, color='blue')
 stock2, stock2_day = get_data(stock_name='GD')
 candle_plot(stocks=[stock2, stock2_day], plot=plot, color='green')

 def callback(attr, old, new):
     stock_name1 = Select1.value
     stock_name2 = Select2.value
     points = range_slider.value
     date1 = datetime.datetime.fromtimestamp(points[0] / 1000)
     date2 = datetime.datetime.fromtimestamp(points[1] / 1000)
     date1, date2 = np.datetime64(date1), np.datetime64(date2)
     data1 = df[df['symbol']==stock_name1]
     data2 = df[df['symbol']==stock_name2]
     data1 = data1.loc[(df['shortened_date'] >= np.datetime64(date1))&(df['shortened_date'] <= np.datetime64(date2))]
     data2 = data2.loc[(df['shortened_date'] >= np.datetime64(date1))&(df['shortened_date'] <= np.datetime64(date2))]

     inc = data1.close > data1.open
     dec = data1.open > data1.close
     stock1.data = {'shortened_date': data1.shortened_date,
                    'high': data1.high ,
                    'low': data1.low,
                    'mean':data1[['high','low']].mean(axis=1),
                    'name': data1['symbol']}
     stock1_day.data = {'inc': data1.shortened_date[inc],
                  'dec': data1.shortened_date[dec],
                  'open_inc': data1.open[inc],
                  'close_inc': data1.close[inc],
                  'open_dec': data1.open[dec],
                  'close_dec': data1.close[dec]}

     inc = data2.close > data2.open
     dec = data2.open > data2.close

     stock2.data = {'shortened_date': data2.shortened_date,
                    'high': data2.high ,
                    'low': data2.low,
                    'mean':data2[['high','low']].mean(axis=1),
                    'name': data2['symbol']}

     stock2_day.data = {'inc': data2.shortened_date[inc],
                    'dec': data2.shortened_date[dec],
                    'open_inc': data2.open[inc],
                    'close_inc': data2.close[inc],
                    'open_dec': data2.open[dec],
                    'close_dec': data2.close[dec]}

 range_slider.on_change('value', callback)
 Select1.on_change('value', callback)
 Select2.on_change('value', callback)
 layout = widgetbox(row(column(Select1, Select2, range_slider), plot))
 curdoc().add_root(layout)```