Hi there,
I have two questions about an interactive plot I’m making. It’s hosted here.
- Is it possible to update legend labels once my plot is hosted on a bokeh server?
I seem to be able to edit the label values before hosting using the following function:
def update_legend():
    for legend in p.legend:
        for legend_item, new_value in zip(legend.items,
                                          [df.loc[f.name].stats.short if f.name is not None else None for f in flist]):
            legend_item.label['value'] = new_value
However, once the plot is hosted on a bokeh server (using heroku) I get the following error, when the function is used in a callback:
2022-12-02T09:58:27.597095+00:00 app[web.1]:     legend_item.label['value'] = new_value
2022-12-02T09:58:27.597095+00:00 app[web.1]: TypeError: 'NoneType' object does not support item assignment
I have a set of ColumnDataSources linked to a set of Patch plots. Each time I load and remove data I want to update the corresponding legend using the callback posted above.
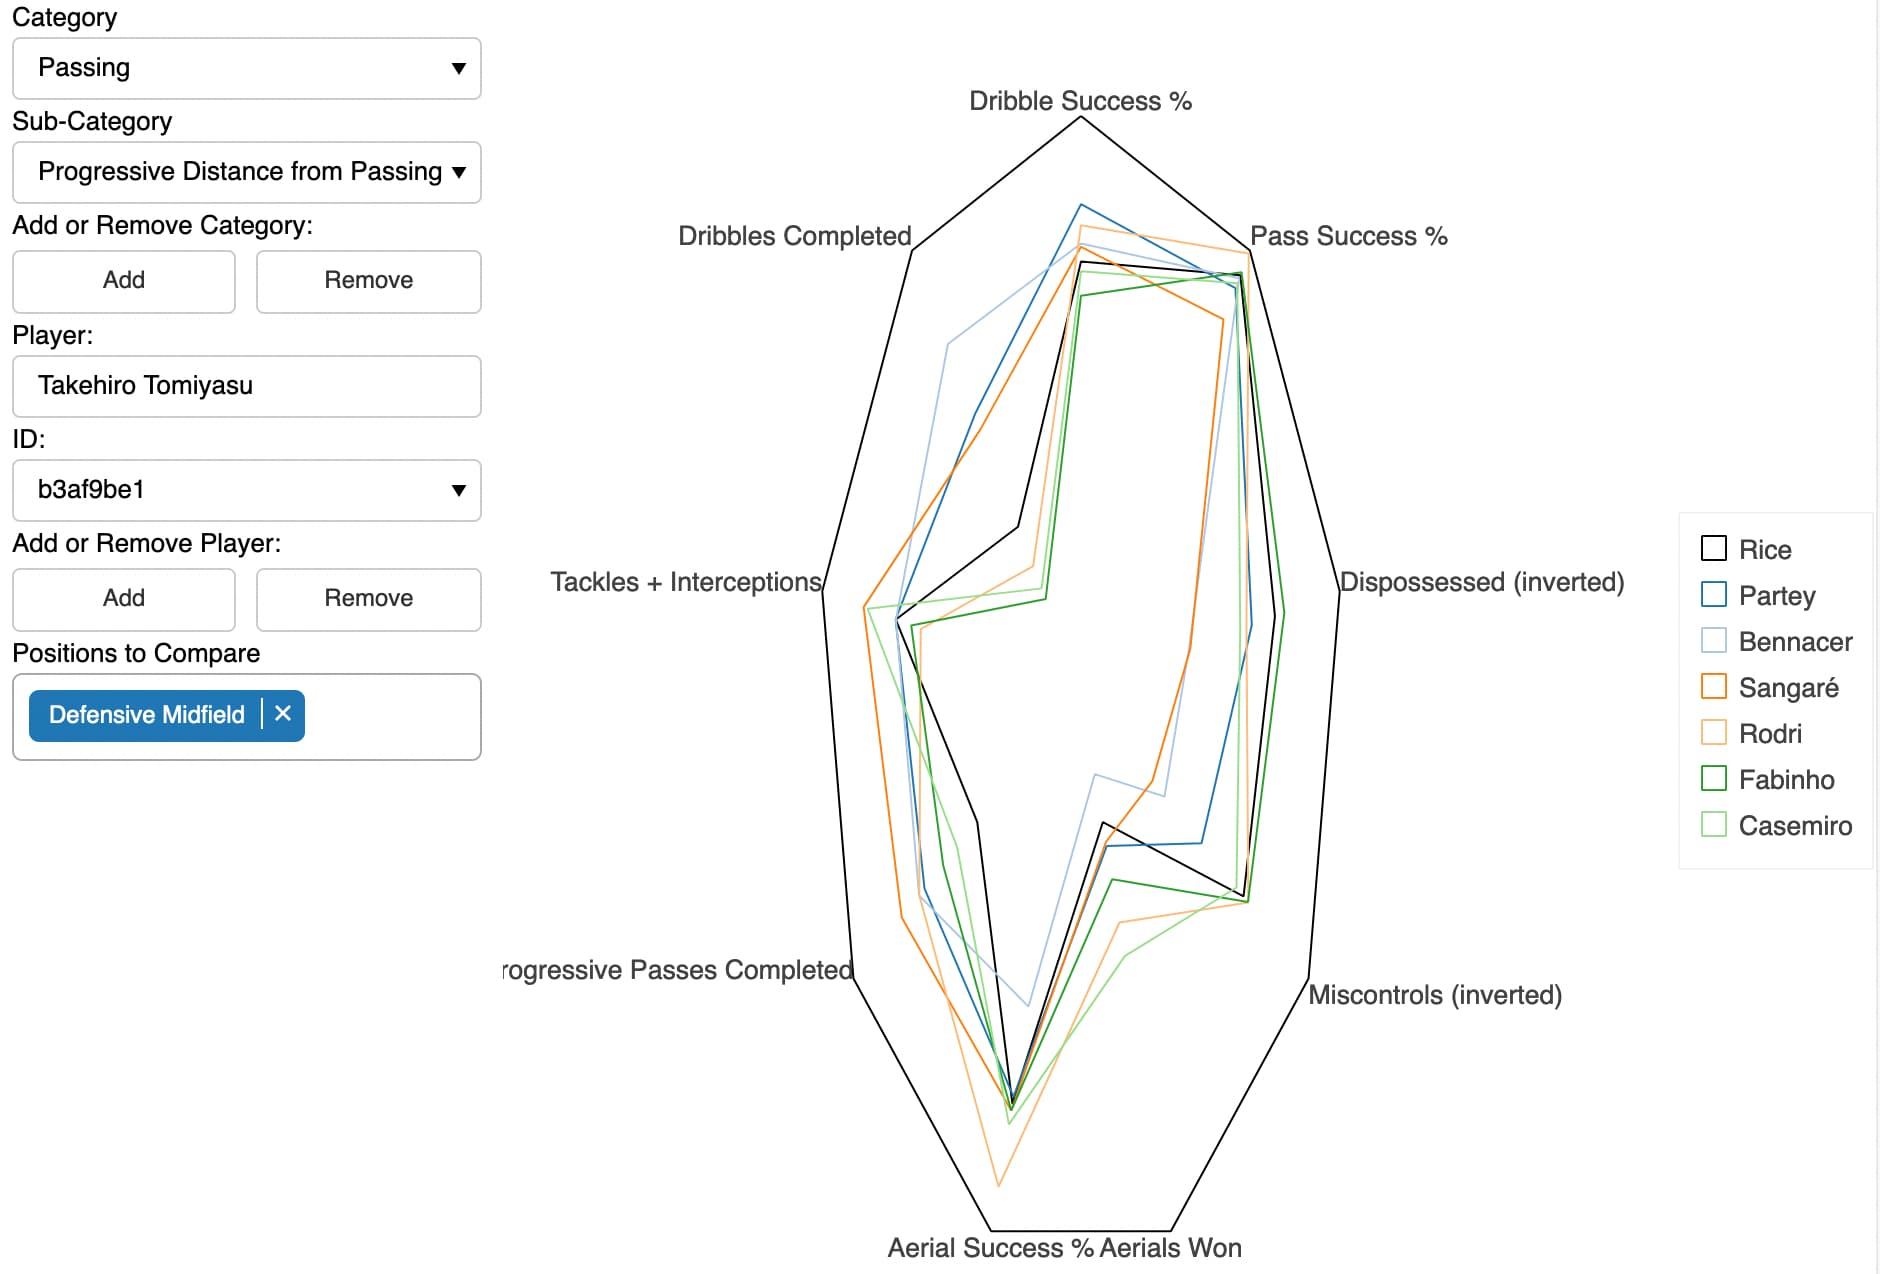
- Is there a way to make a figure have equal axis scales? Especially when the legend is positioned outside of the plot? Currently my figure is distorted (see below).
The code for the radar plot is:
# radar plot
p = figure(title="", toolbar_location=None, height=700, width=700)
p.xgrid.grid_line_color = None
p.ygrid.grid_line_color = None
p.axis.minor_tick_line_color = None
p.xaxis.major_tick_line_color = None  # turn off x-axis major ticks
p.xaxis.minor_tick_line_color = None  # turn off x-axis minor ticks
p.yaxis.major_tick_line_color = None  # turn off y-axis major ticks
p.yaxis.minor_tick_line_color = None  # turn off y-axis minor ticks
p.xaxis.major_label_text_font_size = '0pt'  # turn off x-axis tick labels
p.yaxis.major_label_text_font_size = '0pt'  # turn off y-axis tick labels
p.x_range.start = -0.6
p.x_range.end = 1.6
p.y_range.start = -0.1
p.y_range.end = 1.1
p.match_aspect = True
p.outline_line_color = None
p.axis.visible = False
p.line(x="x", y="y", source=radar_annotation_data, color='black')
labels = LabelSet(x="x", y="y", text="text", source=radar_annotation_data, text_font_size="10pt",
                  text_align='text_align', text_baseline='text_baseline')
p.add_layout(labels)
lis = []
for i in range(len(flist)):
    renderer = p.patch(x='x', y='y', source=flist[i], fill_alpha=0, fill_color=distribution_colours[i],
                       line_color=distribution_colours[i])
    li = LegendItem(label="", renderers=[renderer])
    lis.append(li)
f_legend = Legend(items=lis, location='center', orientation="vertical", glyph_height=15, glyph_width=15,
                  label_text_font_size="10pt")
# p.add_layout(f_legend)
p.add_layout(f_legend, 'right')